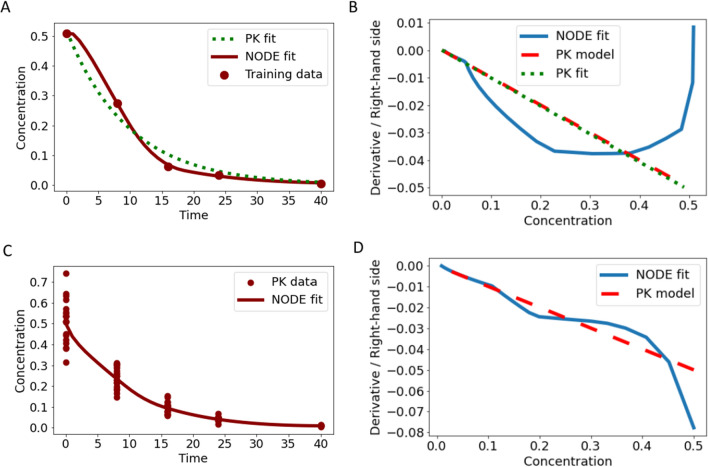
Fig. 4.
In panel A, the fit of the NODE Eq. (6) (red solid line) and the original one-compartment ODE model (green dotted line) to training data (red circles) from single measurements is shown. In panel B, the corresponding derivative versus state plot is presented, highlighting the flexibility and indicating overfitting for the NODE. In panel C and D, pooled training was performed for the NODE Eq. (6), indicating reduced overfitting

