
Figure 9:
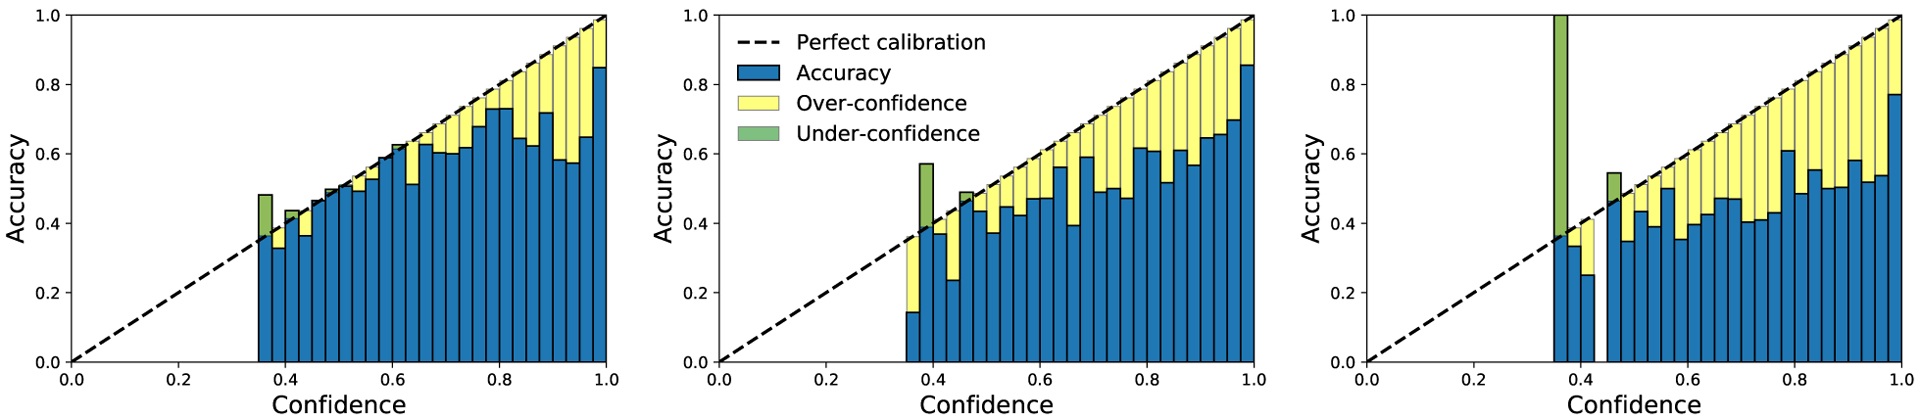
Reliability diagrams (left for non-DP; middle for large ; right for small ) on SNLI with BERT. Note that the large is only used for the last 2500 out of 54000 iterations.
Official websites use .gov
A
.gov website belongs to an official
government organization in the United States.
Secure .gov websites use HTTPS
A lock (
) or https:// means you've safely
connected to the .gov website. Share sensitive
information only on official, secure websites.
Reliability diagrams (left for non-DP; middle for large ; right for small ) on SNLI with BERT. Note that the large is only used for the last 2500 out of 54000 iterations.