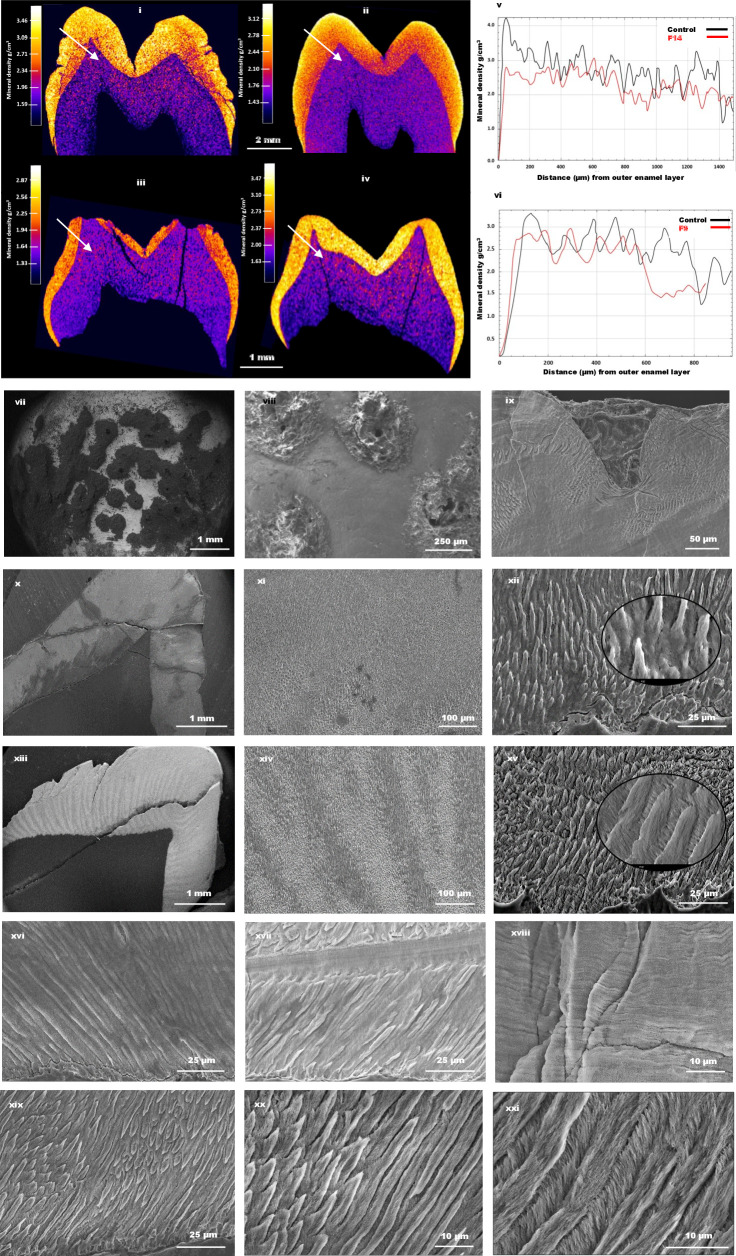
Figure 4.
Laboratory analysis of teeth. (i) Micro-computed tomography (µ-CT) imaging of a permanent upper first premolar tooth from the proband of F14 and (iii) a primary upper molar tooth from the affected individual from F9. Panels (ii) and (iv) have images from corresponding control teeth. No significant differences were observed in average enamel mineral density (EMD) between affected and control samples. F14 and its corresponding control had EMD values of 2.58 and 2.60 g/cm3, respectively, while F9 and its corresponding control were 2.40 and 2.52 g/cm3, respectively. (v–vi) Line graphs showing the distribution of mineral density from the enamel surface to the dental enamel junction (DEJ), as shown by the arrows in (i–iv). Affected samples (red) lack high mineral density at the surface, as opposed to the control teeth (black). Scanning electron microscopy (SEM) images of the enamel in F14 (vii–viii) and F9 show clear pitting extending towards DEJ.51 SEM of enamel from F14 (x–xii) shows generally disrupted and poorly formed prismatic microstructure compared with the corresponding control teeth in the images (xiii–xv), respectively. SEM images of the enamel prism in F9 (xvi–xviii) appears as a stack of lamellae, with patches of fused rod-interrod regions hard to distinguish between them. However, enamel from corresponding controls show distinguishable rod interrod regions (xix–xxi).

