. 2024 Jan 19;84(7):1133–1148. doi: 10.1158/0008-5472.CAN-23-0295

Figure 1.

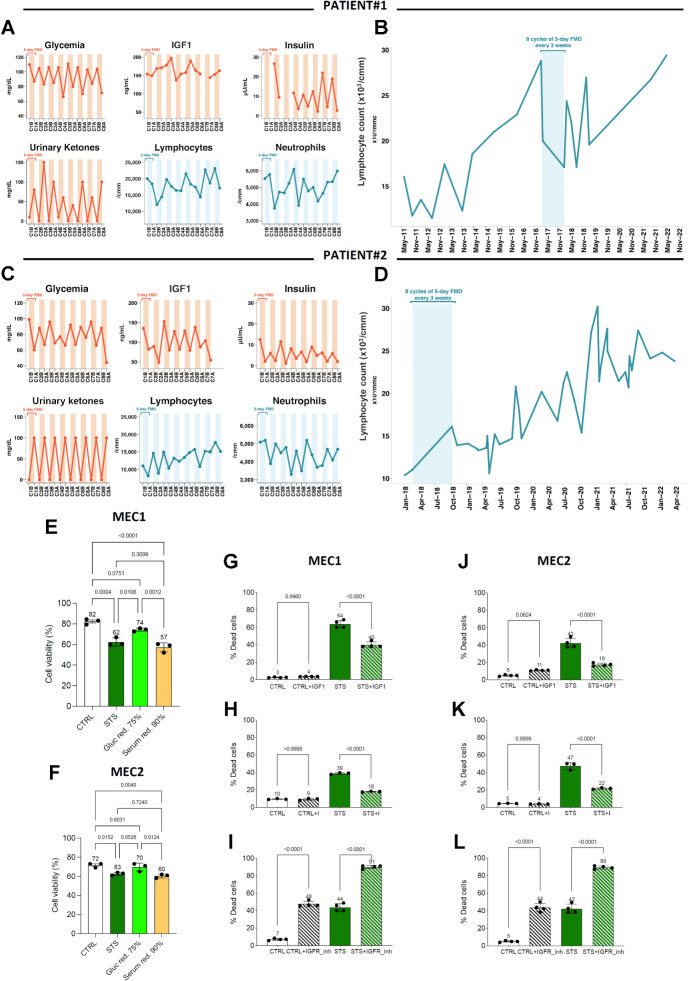
Figure 1. FMD reduces lymphocyte counts in CLL patients and it has mild anti-CLL effects in in vitro models by acting through the IGF axis. A–D, Kinetics of peripheral blood lymphocytes, neutrophils, and metabolic parameters (blood IGF1, glucose, and insulin, and urinary ketone bodies) in two patients with CLL undergoing 8 FMD cycles in the NCT03340935 trial. A and C illustrate long-term lymphocyte kinetics to include the timeframes before and after the dietary intervention. During FMD, blood and urine samples were collected at the initiation and at the end of each FMD cycle to measure the concentration of plasma glucose, serum insulin/IGF1, urinary ketone bodies, as well as total neutrophil and lymphocyte counts (B and D). C1B, cycle 1, before FMD; C1A, cycle 1, after FMD; C2B, cycle 2, before FMD; C2A, cycle 2, after FMD; C3B, cycle 2, before FMD; C3A, cycle 3, after FMD; C4B, cycle 4, before FMD; C4A, cycle 4, after FMD; C5B, cycle 5, before FMD; C5A, cycle 5, after FMD; C6B, cycle 6, before FMD; C6A, cycle 6, after FMD; C7B, cycle 7, before FMD; C7A, cycle 7, after FMD; C8B, cycle 8, before FMD; C8A, cycle 8, after FMD. E and F, Effects of glucose (Gluc red., 75%) or serum (Serum red., 90%) restriction on the viability of MEC1 (E) and MEC2 (F) cells cultured in control (CTRL), STS medium, glucose-restricted medium (75% of glucose reduction as compared with CTRL medium), or serum restricted medium (90% of serum reduction as compared with CTRL medium). Data are presented as the mean ± SD of three independent experiments (n = 3). Statistical significance was determined using a one-way ANOVA test with Tukey post hoc analysis. *, P < 0.05; **, P < 0.01; ***, P < 0.001; ns, not significant. G–L, Effects of IGF1/insulin supplementation and IGFR1 inhibition on the viability of MEC1 (G–I) and MEC2 (J–L) cells cultured in CTRL and STS medium, alone or in combination with IGF, the IGFR1 inhibitor BMS-754807, or insulin. Bar plots indicate the percentage of dead cells at the end of the experiments, and the percentage of dead cells in each replicate is indicated by a single point. The test of proportions was used to compare the ratio of dead cells with or without the IGFR1 inhibitors in each treatment condition.

FMD reduces lymphocyte counts in CLL patients and it has mild anti-CLL effects in in vitro models by acting through the IGF axis. A–D, Kinetics of peripheral blood lymphocytes, neutrophils, and metabolic parameters (blood IGF1, glucose, and insulin, and urinary ketone bodies) in two patients with CLL undergoing 8 FMD cycles in the NCT03340935 trial. A and C illustrate long-term lymphocyte kinetics to include the timeframes before and after the dietary intervention. During FMD, blood and urine samples were collected at the initiation and at the end of each FMD cycle to measure the concentration of plasma glucose, serum insulin/IGF1, urinary ketone bodies, as well as total neutrophil and lymphocyte counts (B and D). C1B, cycle 1, before FMD; C1A, cycle 1, after FMD; C2B, cycle 2, before FMD; C2A, cycle 2, after FMD; C3B, cycle 2, before FMD; C3A, cycle 3, after FMD; C4B, cycle 4, before FMD; C4A, cycle 4, after FMD; C5B, cycle 5, before FMD; C5A, cycle 5, after FMD; C6B, cycle 6, before FMD; C6A, cycle 6, after FMD; C7B, cycle 7, before FMD; C7A, cycle 7, after FMD; C8B, cycle 8, before FMD; C8A, cycle 8, after FMD. E and F, Effects of glucose (Gluc red., 75%) or serum (Serum red., 90%) restriction on the viability of MEC1 (E) and MEC2 (F) cells cultured in control (CTRL), STS medium, glucose-restricted medium (75% of glucose reduction as compared with CTRL medium), or serum restricted medium (90% of serum reduction as compared with CTRL medium). Data are presented as the mean ± SD of three independent experiments (n = 3). Statistical significance was determined using a one-way ANOVA test with Tukey post hoc analysis. *, P < 0.05; **, P < 0.01; ***, P < 0.001; ns, not significant. G–L, Effects of IGF1/insulin supplementation and IGFR1 inhibition on the viability of MEC1 (GI) and MEC2 (JL) cells cultured in CTRL and STS medium, alone or in combination with IGF, the IGFR1 inhibitor BMS-754807, or insulin. Bar plots indicate the percentage of dead cells at the end of the experiments, and the percentage of dead cells in each replicate is indicated by a single point. The test of proportions was used to compare the ratio of dead cells with or without the IGFR1 inhibitors in each treatment condition.