. 2024 Jan 19;84(7):1133–1148. doi: 10.1158/0008-5472.CAN-23-0295

Figure 3.

Figure 3. Impact of STS and bortezomib on cell-cycle progression and apoptosis. A–C, Cell-cycle analysis using PI staining and flow cytometry. A, Cell-cycle distribution of MEC1 cells treated with CTRL, STS, bortezomib (BTZ), rituximab (RTX), STS + rituximab, STS + bortezomib, bortezomib + rituximab, or STS + bortezomib + rituximab for 36 hours, as assessed by FACS analysis of PI incorporation. B, Cell-cycle distribution analysis after 42 hours of treatment. C, Cell-cycle distribution analysis after 48 hours of treatment. Data are presented as mean ± SD of three independent experiments. D and E, Proapoptotic effects of STS, bortezomib, or STS + bortezomib, alone or in combination with rituximab, in MEC1 and MEC2 cells. The percentage of Annexin V–positive (apoptotic) cells among total cancer cells was quantified by FACS analysis at 36 hours in MEC1 cells (D) and MEC2 cells (E) after exposure to the indicated treatments. Data are presented as mean ± SEM of three independent experiments. F and G, Western blot analysis of the expression of caspase-3, cleaved caspase-3, Noxa, PUMA, and BIM protein levels in MEC1 (F) and MEC2 (G) cells exposed to STS, bortezomib, or their combination, compared to with untreated control cells. Western blot data were replicated in tso independent experiments. Vinculin was used as a protein loading control.

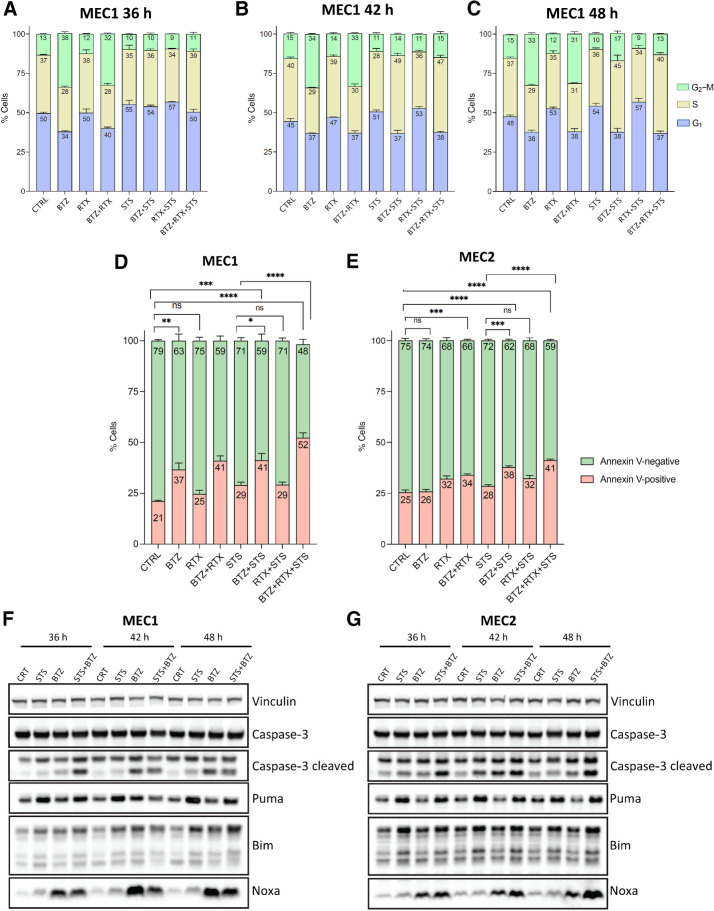
Impact of STS and bortezomib on cell-cycle progression and apoptosis. A–C, Cell-cycle analysis using PI staining and flow cytometry. A, Cell-cycle distribution of MEC1 cells treated with CTRL, STS, bortezomib (BTZ), rituximab (RTX), STS + rituximab, STS + bortezomib, bortezomib + rituximab, or STS + bortezomib + rituximab for 36 hours, as assessed by FACS analysis of PI incorporation. B, Cell-cycle distribution analysis after 42 hours of treatment. C, Cell-cycle distribution analysis after 48 hours of treatment. Data are presented as mean ± SD of three independent experiments. D and E, Proapoptotic effects of STS, bortezomib, or STS + bortezomib, alone or in combination with rituximab, in MEC1 and MEC2 cells. The percentage of Annexin V–positive (apoptotic) cells among total cancer cells was quantified by FACS analysis at 36 hours in MEC1 cells (D) and MEC2 cells (E) after exposure to the indicated treatments. Data are presented as mean ± SEM of three independent experiments. F and G, Western blot analysis of the expression of caspase-3, cleaved caspase-3, Noxa, PUMA, and BIM protein levels in MEC1 (F) and MEC2 (G) cells exposed to STS, bortezomib, or their combination, compared to with untreated control cells. Western blot data were replicated in tso independent experiments. Vinculin was used as a protein loading control.