Figure 1.
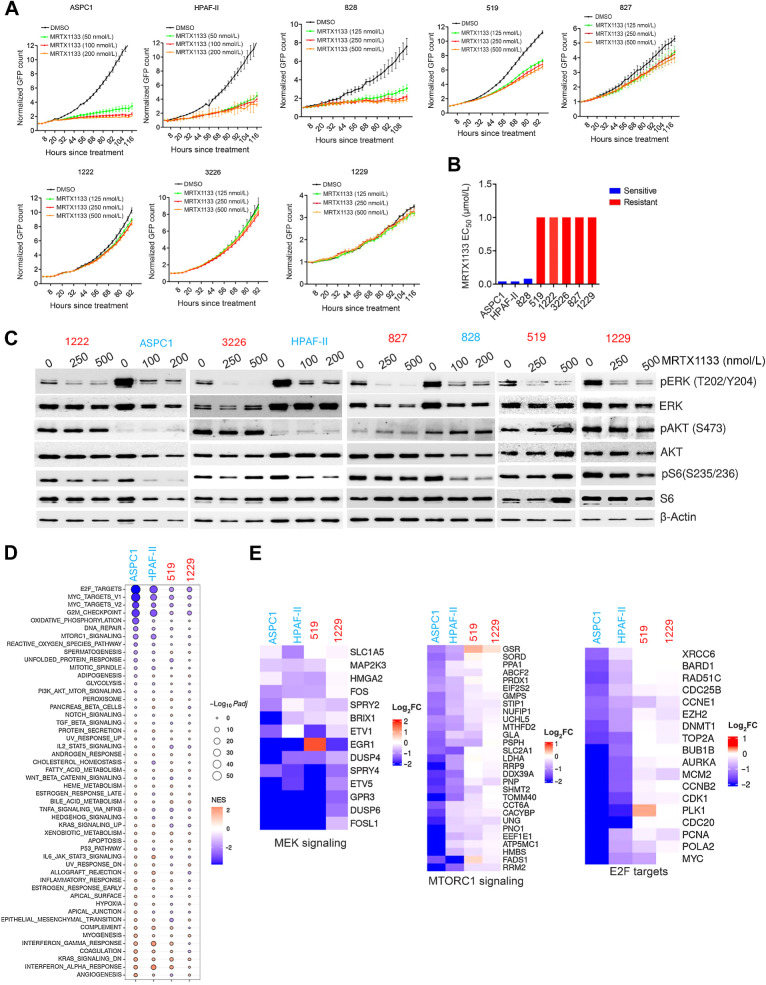
Cellular response to MRTX1133 in a panel of KRASG12D mutant PDAC cell lines. A, Live cell imaging using IncuCyte S3 on the indicated cell lines treated with different concentrations of MRTX1133. Cell proliferation was determined on the basis of the GFP counts. Graph represents mean and SD from triplicates. Experiments were done at two independent times. B, EC50 values of MRTX1133 on different PDAC cell lines were calculated on the basis of the dose–response curve. To determine the drug effect at each dose, the fold change in cell number after 5 days of treatment was normalized to untreated condition. C, Immunoblotting of the indicated cell lines treated to examine the effect of MRTX1133 on the KRAS-mediated signaling pathways following 24 hours treatment at different concentrations. D, Bubble plot depicting the differentially expressed pathways that were ranked on the basis of gene set enrichment scores and their P values on the indicated cell lines in the presence of MRTX1133 (100 nmol/L). E, Heatmap depicting the differential expression of the indicated genes that are involved in MEK signaling, MTOR signaling, and E2F-regulated cell-cycle genes.

