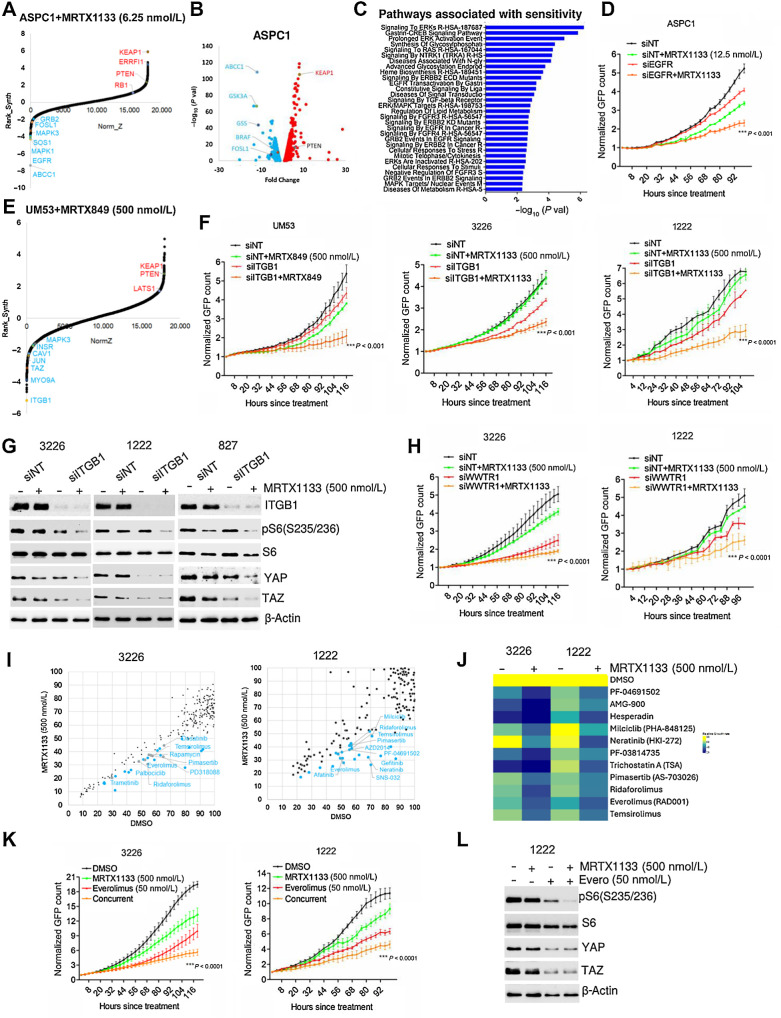
Figure 2.
Combinatorial approach to overcome resistance to MRTX1133. A, DrugZ analysis in ASPC1 cells indicating the genes that were negatively selected during the MRTX1133 (6.25 nmol/L) treatment. B, Volcano plot indicating the genes whose sgRNAs are differentially selected in the presence of MRTX1133 (6.25 nmol/L) in ASPC1 cells. The individual guides were filtered with a Z-score <−1.96 and >1.96 (95% CI) based on the DrugZ analysis. C, ENRICHR analysis to determine the pathways that are associated with the negatively selected genes from ASPC1 cells. D, Live cell imaging to monitor the proliferation of ASPC1 cells following EGFR deletion in the absence and presence of MRTX1133. E, DrugZ analysis in UM53 cells indicating the genes that were negatively selected during the MRTX849 (500 nmol/L) treatment. F, Effect of ITGB1 knockdown in UM53, 326, and 1222 cells in the absence and presence of MRTX1133 and MRTX849 at the indicated concentrations on cell proliferation. G, Biochemical analysis in 3226, 1222, and 827 cells on the indicated proteins following ITGB1 knockdown in combination with MRTX1133 (500 nmol/L). H, Effect of WWTR1 deletion on the proliferation of 1222 and 3226 cells treated with MRTX1133 upto 5 days. I, Scatter plot analysis in 1222 and 3226 cell lines following a combinatorial drug screen. Each dot represents a drug from the library. X-axis indicates the effect of individual drugs from the library. Y-axis represents the impact of MRTX1133 combination on the individual drugs from the library. The drug effect was calculated on the basis of the fold change in cell number following 5 days of treatment normalized to the mean vehicle-treated groups in the library. J, Heatmap depicting the effect of the indicated drugs in combination with MRTX1133 on 1222 and 3226 cells. K, Live cell imaging to validate the effect of everolimus in combination with MRTX1133 on the proliferation of 1222 and 3226 until the indicated times. L, Western blotting of the indicated proteins from 1222 cells following the treatment with MRTX1133 in combination with everolimus. Error bars in all the graphs represent mean and SD from triplicates. ***, P < 0.0001 as determined by two-way ANOVA. Experiment was done at two individual times.

