. 2024 Jan 31;84(7):1115–1132. doi: 10.1158/0008-5472.CAN-23-2504

Figure 5.

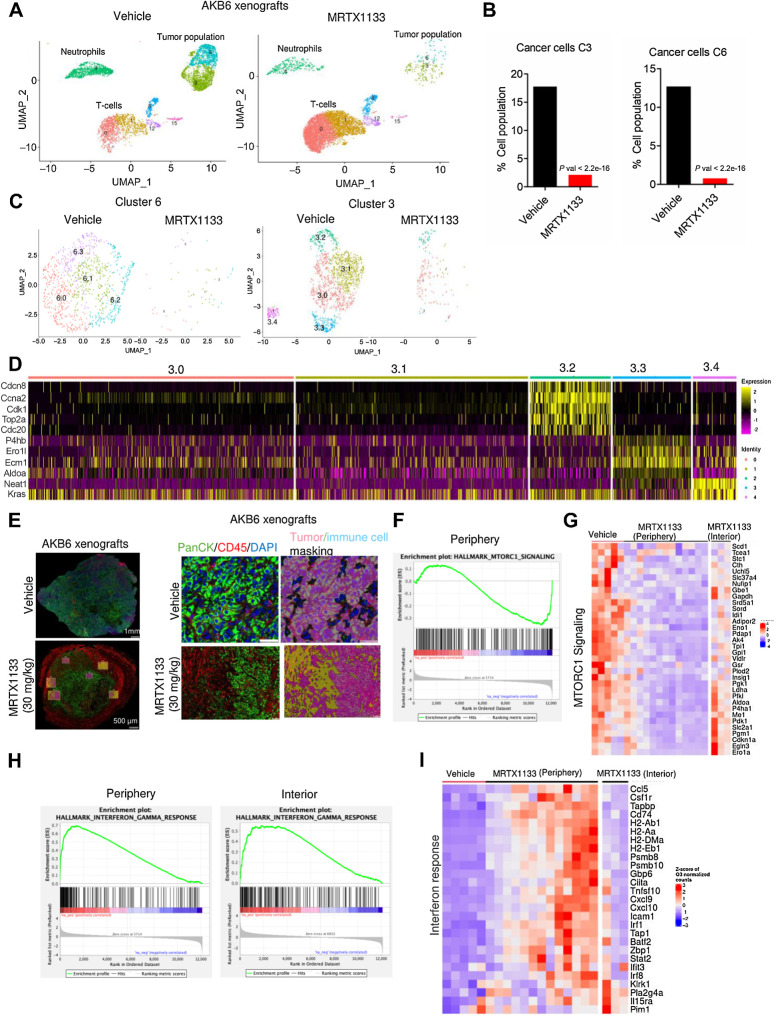
Figure 5. Mechanistic investigation of in vivo effect of MRTX1133. A, Single-cell clustering of vehicle- and MRTX1133-treated AKB6 tumors to selectively indicate tumor cells, T cells, and neutrophils. B, Bar graph indicating the tumor cell population from the vehicle and MRTX1133 samples. P value was determined by Fisher exact test. C, Subclustering of the tumor population 6 and 3 from the vehicle- and MRTX1133-treated samples. D, Seurat heat map depicting the relative expression of the indicated genes across the subclusters from tumor cluster 3. E, Representative tumor images from AKB6 xenografts that were treated with vehicle (n = 2) and MRTX1133 (n = 4) and stained with PanCK, CD45, and DAPI. Different ROIs that include the periphery and exterior of the tumor tissues were selected for DSP analysis. Representative image of an ROI, demarcating the tumor and stromal population based on PANCK and CD45 staining, respectively, and the masking was performed appropriately. F, GSEA analysis identified a significant enrichment of MTOR signaling, which is downregulated in the MRTX1133-treated tumor in the peripheral region. G, Heat map depicting the expression of the indicated genes from the vehicle-treated tumors across different ROIs and MRTX1133-treated tumors from different ROIs that include both the periphery and the interior regions. H, GSEA analysis comparing the enrichment of IFNγ signaling pathway, which is differentially upregulated between the periphery and interior regions of the tumor following MRTX1133 treatment. I, Heatmap depicting the upregulation of indicated genes from the vehicle- and MRTX1133-treated tumor tissues. The impact of MRTX1133 on those genes were compared between the periphery and interior regions of the tumor.

Mechanistic investigation of in vivo effect of MRTX1133. A, Single-cell clustering of vehicle- and MRTX1133-treated AKB6 tumors to selectively indicate tumor cells, T cells, and neutrophils. B, Bar graph indicating the tumor cell population from the vehicle and MRTX1133 samples. P value was determined by Fisher exact test. C, Subclustering of the tumor population 6 and 3 from the vehicle- and MRTX1133-treated samples. D, Seurat heat map depicting the relative expression of the indicated genes across the subclusters from tumor cluster 3. E, Representative tumor images from AKB6 xenografts that were treated with vehicle (n = 2) and MRTX1133 (n = 4) and stained with PanCK, CD45, and DAPI. Different ROIs that include the periphery and exterior of the tumor tissues were selected for DSP analysis. Representative image of an ROI, demarcating the tumor and stromal population based on PANCK and CD45 staining, respectively, and the masking was performed appropriately. F, GSEA analysis identified a significant enrichment of MTOR signaling, which is downregulated in the MRTX1133-treated tumor in the peripheral region. G, Heat map depicting the expression of the indicated genes from the vehicle-treated tumors across different ROIs and MRTX1133-treated tumors from different ROIs that include both the periphery and the interior regions. H, GSEA analysis comparing the enrichment of IFNγ signaling pathway, which is differentially upregulated between the periphery and interior regions of the tumor following MRTX1133 treatment. I, Heatmap depicting the upregulation of indicated genes from the vehicle- and MRTX1133-treated tumor tissues. The impact of MRTX1133 on those genes were compared between the periphery and interior regions of the tumor.