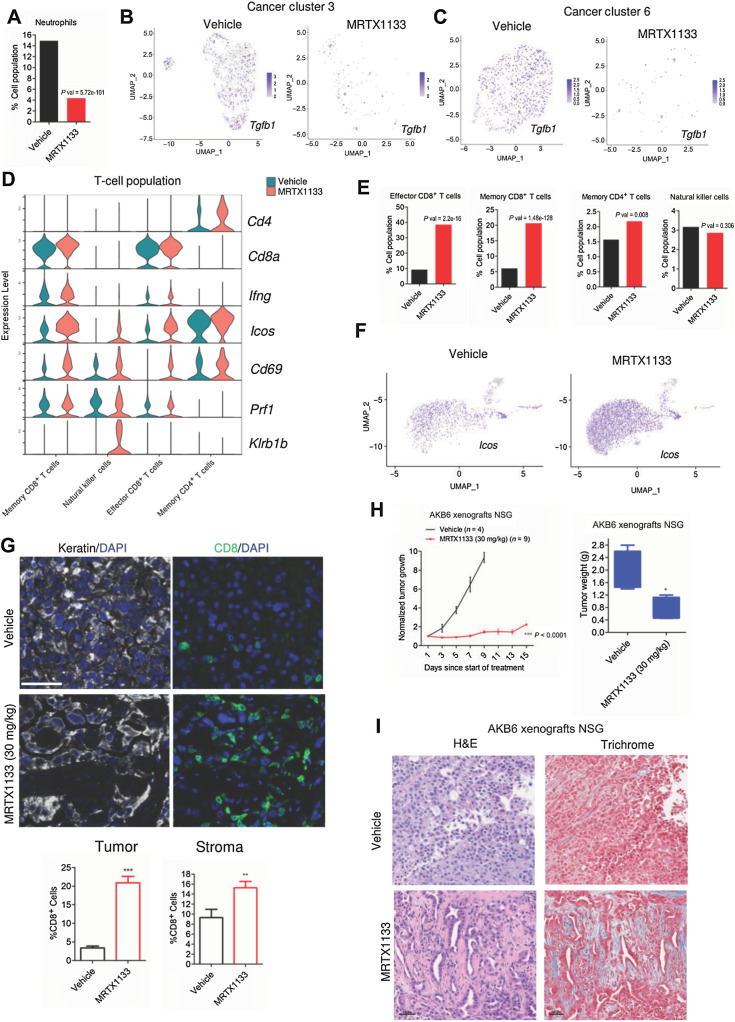
Figure 6.
Impact of MRTX1133 on the TME and host immune system. A, Column graph indicating the neutrophils population in the absence and presence of MRTX1133. P value was determined by Fisher exact test. B, Seurat feature plot to illustrate the differential expression of Tgfb1 between the vehicle- and MRTX1133-treated groups from the tumor cluster 3. C, Seurat feature plot to illustrate the differential expression of Tgfb1 between the vehicle- and MRTX1133-treated groups from the tumor cluster 6. D, Violin plots indicating the expression of indicated genes within the neutrophil population in the presence and absence of MRTX1133. E, Column graphs indicating the different T-cell populations that comprise memory CD8+ T cells, Effector CD8+ T cells, NKT cells, and memory CD4+ T cells following MRTX1133 treatment. P values were determined by Fisher exact test. F, Seurat feature plots to illustrate the differential expression of Icos, which is a T-cell marker from the vehicle- and MRTX1133-treated groups. G, Representative images from the multispectral staining on the AKB6 tumors (PanKeratin, CD8, and DAPI). Scale bar, 30 μm. The column graph represents the fraction of CD8-positive cells from the stroma and tumor following the treatment with MRTX1133. Mean and SEM were determined from six ROIs from vehicle (n = 3)- and MRTX1133 (n = 3)-treated tumor tissues. **, P < 0.01; ***, P < 0.0001 as determine by Student t test. H,In vivo effect of MRTX1133 on the tumor growth of AKB6 xenografts in NSG mice. Column graph representing the tumor weights from the AKB6 xenografts derived from NSG strain treated with vehicle and MRTX1133. Mean and SEM are shown. *, P < 0.05 as determined by Student t test. I, Representative images of H&E and Masson's Trichrome staining from AKB6 xenografts derived from NSG strain treated with vehicle and MRTX1133 (30 mg/kg). Scale bar, 50 μm.

