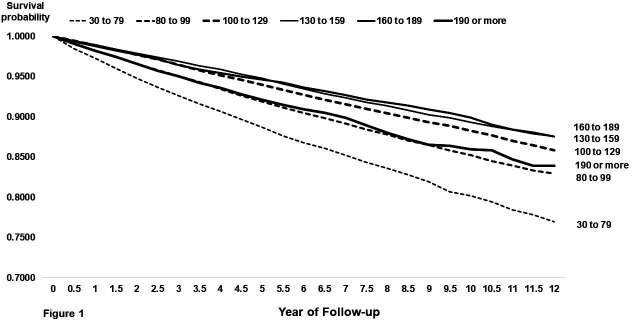
Figure 1.
Plot of cumulative mortality rates in 6-month intervals over 12 years of follow-up by baseline low-density lipoprotein cholesterol (LDL-C) category. Dashed lines depict the three lowest LDL-C categories (30–79, 80–99 and 100–129 mg/dL) and solid lines depict the highest LDL-C categories (130–159, 160–189 and ≥190 mg/dL).

