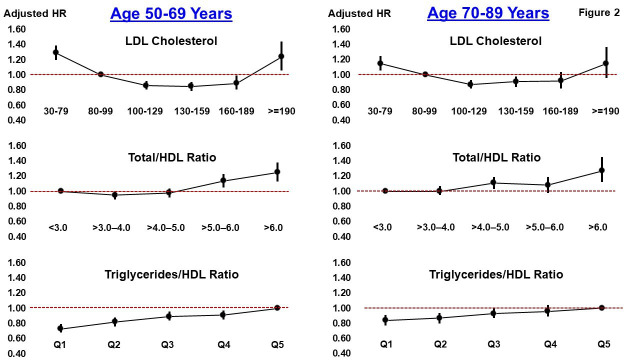
Figure 2.
Plot of mortality HRs (filled circles) and 95% CIs (vertical lines) across categories of LDL cholesterol (top), total cholesterol to HDL cholesterol ratio (middle) and triglycerides to HDL cholesterol ratio (bottom). The left side of the graph is for patients aged 50–69 years; the right side is for patients aged 70–89 years. The dashed line reflects the referent group null value (1.0) for the HR. Q: quintile. Each model is adjusted for age, race, sex, BMI, current smoker, former smoker and history of the following in the past year: hypertension, atrial fibrillation, arrhythmia, congestive heart failure, cancer, chronic obstructive pulmonary disease, chronic kidney disease, baseline systolic and diastolic blood pressure, glucose and the following medications in the past year: ACE inhibitors, beta-blockers, calcium blockers, any SBP lowering medication, diuretics, aspirin, DOACs, antidepressants, opioids and statin initiation >1 year after baseline cholesterol measurement. BMI, Body Mass Index; DOAC, direct oral anticoagulant; HDL, high-density lipoprotein; LDL, low-density lipoprotein; SBP, systolic blood pressure.

