
Figure 3.
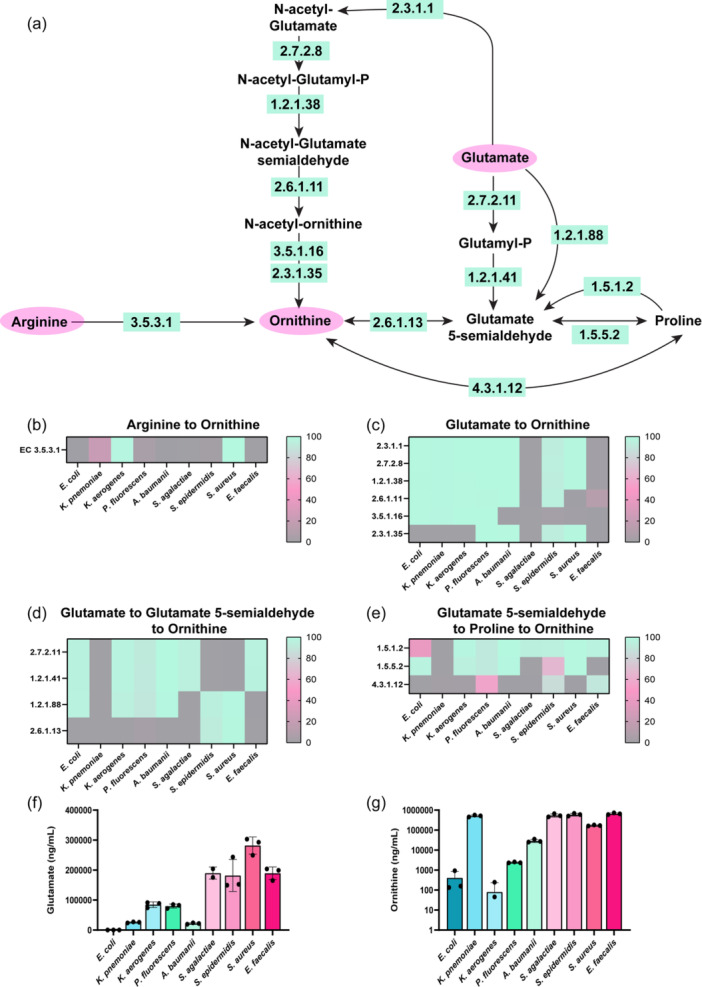
(a) Simplified diagram of the pathways to convert Arginine and Glutamate to Ornithine with the corresponding enzyme commission (EC) numbers responsible for these reactions. Percentage of bacterial genomes harboring ECs involved in the conversion of (b) Arginine to Ornithine, (c) Glutamate to Ornithine, (d) Glutamate to Glutamate‐5‐semialdehyde to Ornithine, (e) Glutmate‐5‐semialdhyde to Proline to Ornithine. Quantitative LC‐MS/MS‐based targeted metabolomics data of bacterial supernatant for the absolute concentrations of (f) Glutamate, and (g) Ornithine. n = 3; biological triplicate of bacteria samples. Each dot represents an individual data point.