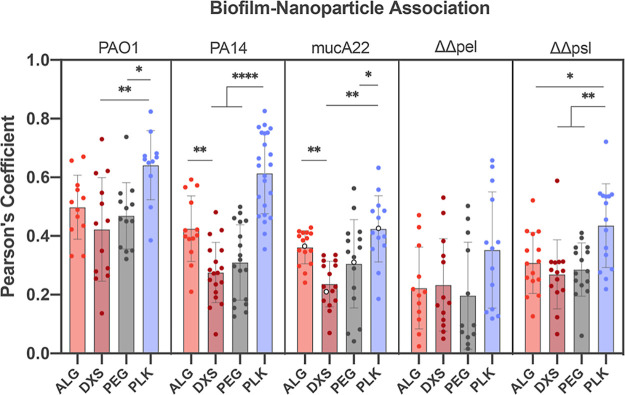
Figure 3.
Biofilm-NP colocalization using Pearson’s coefficient reveals a strain-specific increase in ALG NP biofilm association as compared to DXS. Statistics are calculated within each bacterial strain. One-way ANOVAs with Tukey’s correction for multiple comparisons were used, where * means p < 0.05, ** means p < 0.01, and **** means P < 0.0001. N = 3 independent biofilms were tested, and N = 5 images were taken per biofilm, though co-occurrence data of 1.0 were considered artifacts of the image analysis software and were excluded. Note that the open circles in mucA22 are shown as representative images in Figure 4.

