Figure 1.
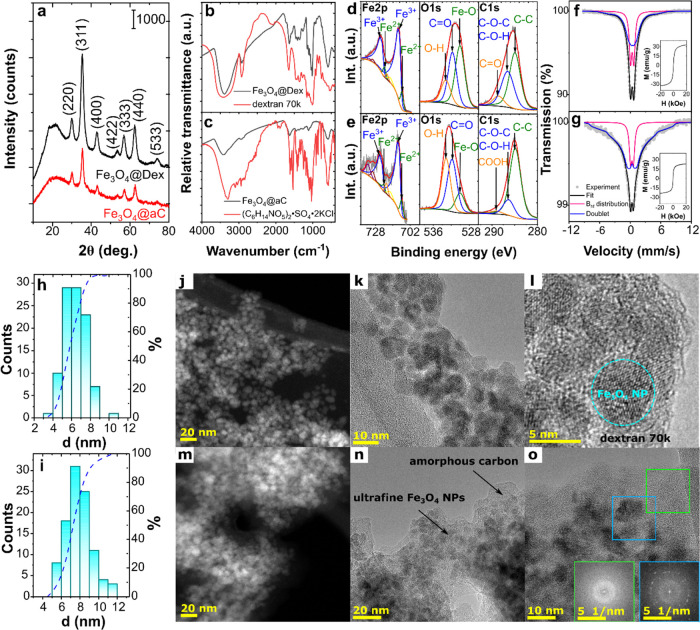
Structure and magnetic properties of Fe3O4@Dex and Fe3O4@aC: XRD patterns of samples (a) with marked Miller indices of the magnetite spinel phase; comparison of FTIR spectra of Fe3O4@Dex (b) and Fe3O4@aC (c) with spectra of pure organic modifiers; deconvolution of XPS spectra of Fe 2p, O 1s, and C 1s core lines obtained for Fe3O4@Dex (d) and Fe3O4@aC (e); and Mössbauer spectra of Fe3O4@Dex (f) and Fe3O4@aC (g) with fitted curves (the dots, black solid lines, pink and blue represent experimental data, fitted curves, hyperfine magnetic distribution and doublets, respectively). Insets show the recorded VSM curves; size-distribution histograms with cumulative curves plotted for Fe3O4@Dex (h) and Fe3O4@aC (i) and TEM images of Fe3O4@Dex (j–l) and Fe3O4@aC (m–o) nanoparticles in STEM (j, m) and HRTEM (k, l, n and o) modes; insets show the FFTs from the green and blue marked areas (o).

