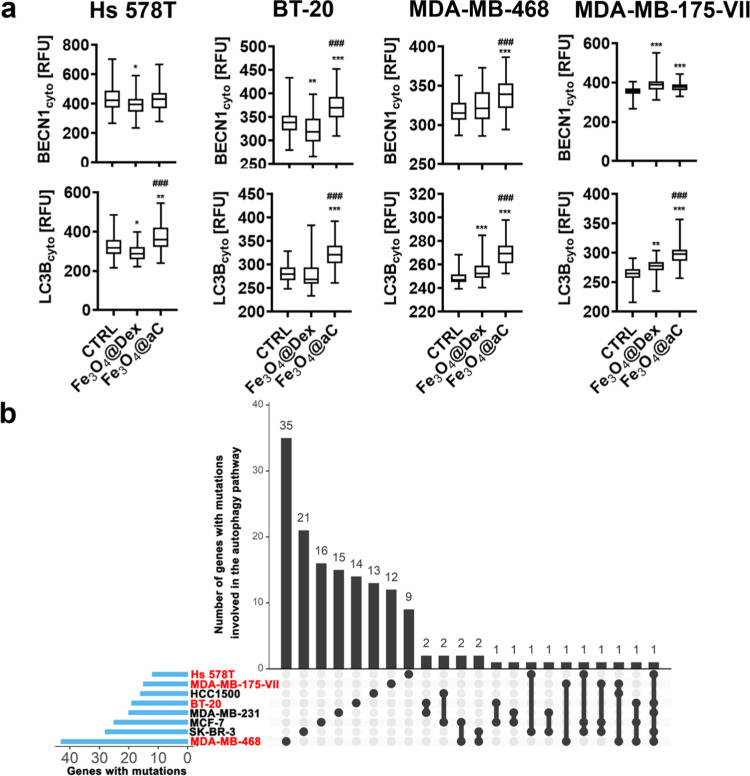
Figure 8.
Autophagy induction in drug-induced senescent breast cancer cells treated with encapsulated Fe3O4 NPs (a). The number of gene mutations involved in the regulation of the autophagy pathway in studied cell lines (in red) is also shown (b). (a) Senescence program was activated using etoposide treatment. Senescent breast cancer cells were treated with 100 μg/mL NPs for 4 h. The cytoplasmic levels of BECN1 and LCB3 were analyzed in fixed cells using immunostaining and imaging cytometry. The levels of BECN1 and LCB3 are presented in relative fluorescence units (RFU). Box and whisker plots are shown, n = 3, ***p < 0.001, **p < 0.01, and *p < 0.05 compared to untreated control (ANOVA and Dunnett’s a posteriori test); ###p < 0.001 compared to Fe3O4@Dex treatment (ANOVA and Tukey’s a posteriori test). CTRL, untreated control; Fe3O4@Dex, dextran-based coated iron oxide nanoparticles; and Fe3O4@aC, glucosamine-based amorphous carbon-coated iron oxide nanoparticles. (b) Gene mutation raw data were downloaded from the DepMap portal (https://depmap.org/portal/). Set intersections in a matrix layout were visualized using the UpSet plot. Total, shared, and unique gene mutations in genes involved in the regulation of the autophagy pathway across eight breast cancer cell lines are presented. Blue bars in the y-axis denote the total number of gene mutations in each cell line. Black bars in the x-axis denote the number of mutations shared across cell lines connected by the black dots in the body of the plot.

