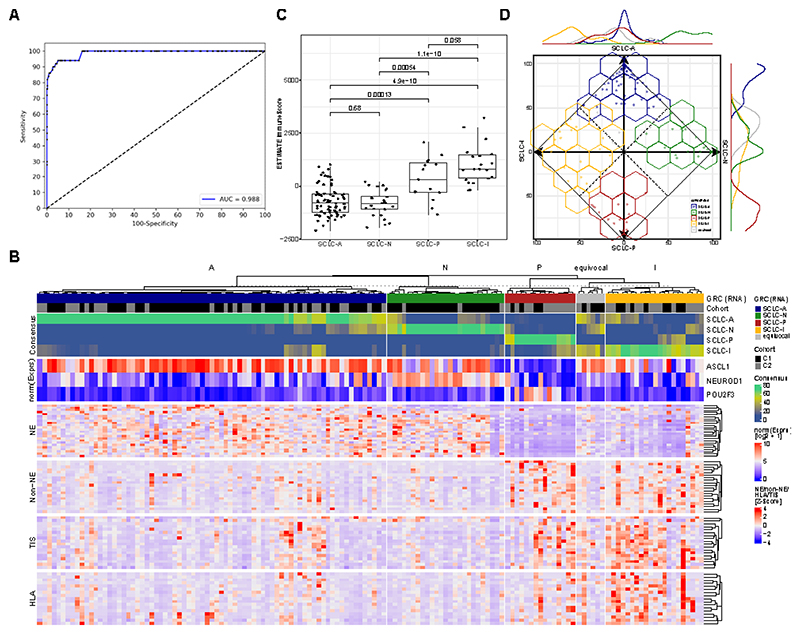
Figure 1. Detection and Classification of SCLC.
A Receiver operator characteristics (ROC) analysis of a DNA methylation-based test for the detection of SCLC from plasma. B Predictive models were generated to classify SCLC based on RNA-seq (Gene Ratio Classifier; GRC) and consensus of several combined predictive models is shown. A subtype was called when the consensus > 0.5, else a sample was called equivocal. In addition, the expression of the three transcription factors ASCL1 (for SCLC-A), NEUROD1 (for SCLC-N) and POU2F3 (for SCLC-P) is shown normalized across the two cohorts. Furthermore, genes involved in neuroendocrine and non-neuroendocrine (Non-NE) as well as in tumor inflammation (TIS) and expression of HLA is shown. C Immune infiltration estimation using RNA-seq data (using the ESTIMATE algorithm). Boxplot shows the median as thick line, the box highlighting the first and third quartile with the whiskers highlighting 1.5x the interquartile range. D Characterization of SCLC consensus heterogeneity. The consensus agreement value for each subtype is plotted on the axis for each subtype by its consensus fraction of the respective subtype, demonstrating overlaps between SCLC subtypes. The line plot at the axis characterizes the distribution of subtypes across the axis. Wilcoxon test was used to compute p-values between groups.

