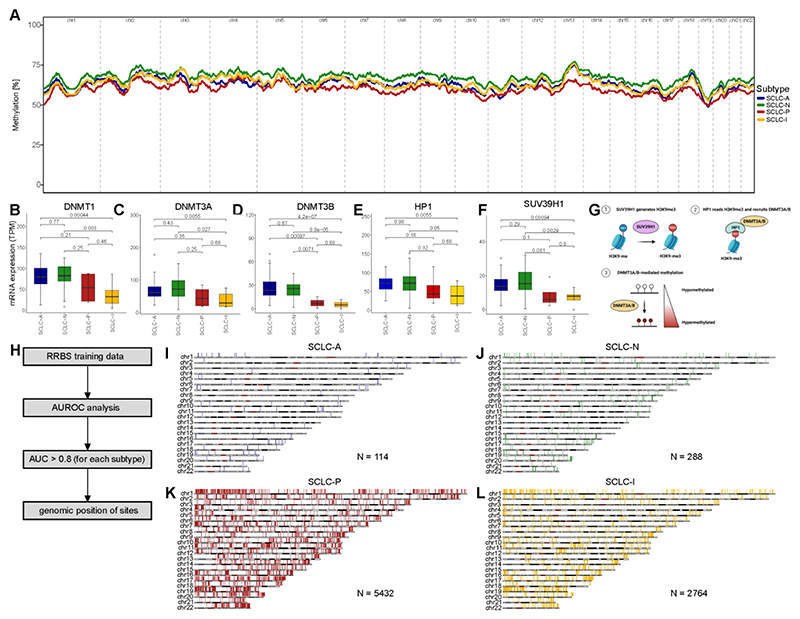
Figure 2. Subtype-specific DNA methylation in SCLC.
A DNA methylation was assessed using reduced-representation bisulfite sequencing (RRBS) and DNA methylation was averaged per sample and subtype over 100kbp bins and the rolling average over 500 bins (= 50mbp) is highlighted in the c1 tumor samples. B-G Analysis of gene expression per SCLC subtype for DNA-methyltransferase 1 (DNMT1; B), DNA-methyltransferase 3A (DNMT3A; C) and 3B (DNMT3B; D), methionine adenosyltransferase 2A (MAT2A; E) and histone lysine methyltransferase (SUV39H1; F). G Overview of mechanism that links SUV39H1 expression with histone methylation. H Scheme highlighting the analysis and selection of DNA methylation sites associated with each of the SCLC subtypes using 100bp bins. By calculating the area under the curve by receiver operator characteristics (AUROC) we defined genomic region with high (AUC > 0.8) association with one the four respective subtypes. DNA methylation bins are shown related to their position within the genome for each chromosome for SCLC-A (I), SCLC-N (J), SCLC-P (K) and SCLC-I (L) and number of regions is stated for each subtype. Boxplot shows the median as thick line, the box highlighting the first and third quartile with the whiskers highlighting 1.5x the interquartile range. Wilcoxon test was used to compute p-values between groups.
See also Figures S2-5 and Table S2.

