
Figure 3: DNA methylation-based subtyping in SCLC.
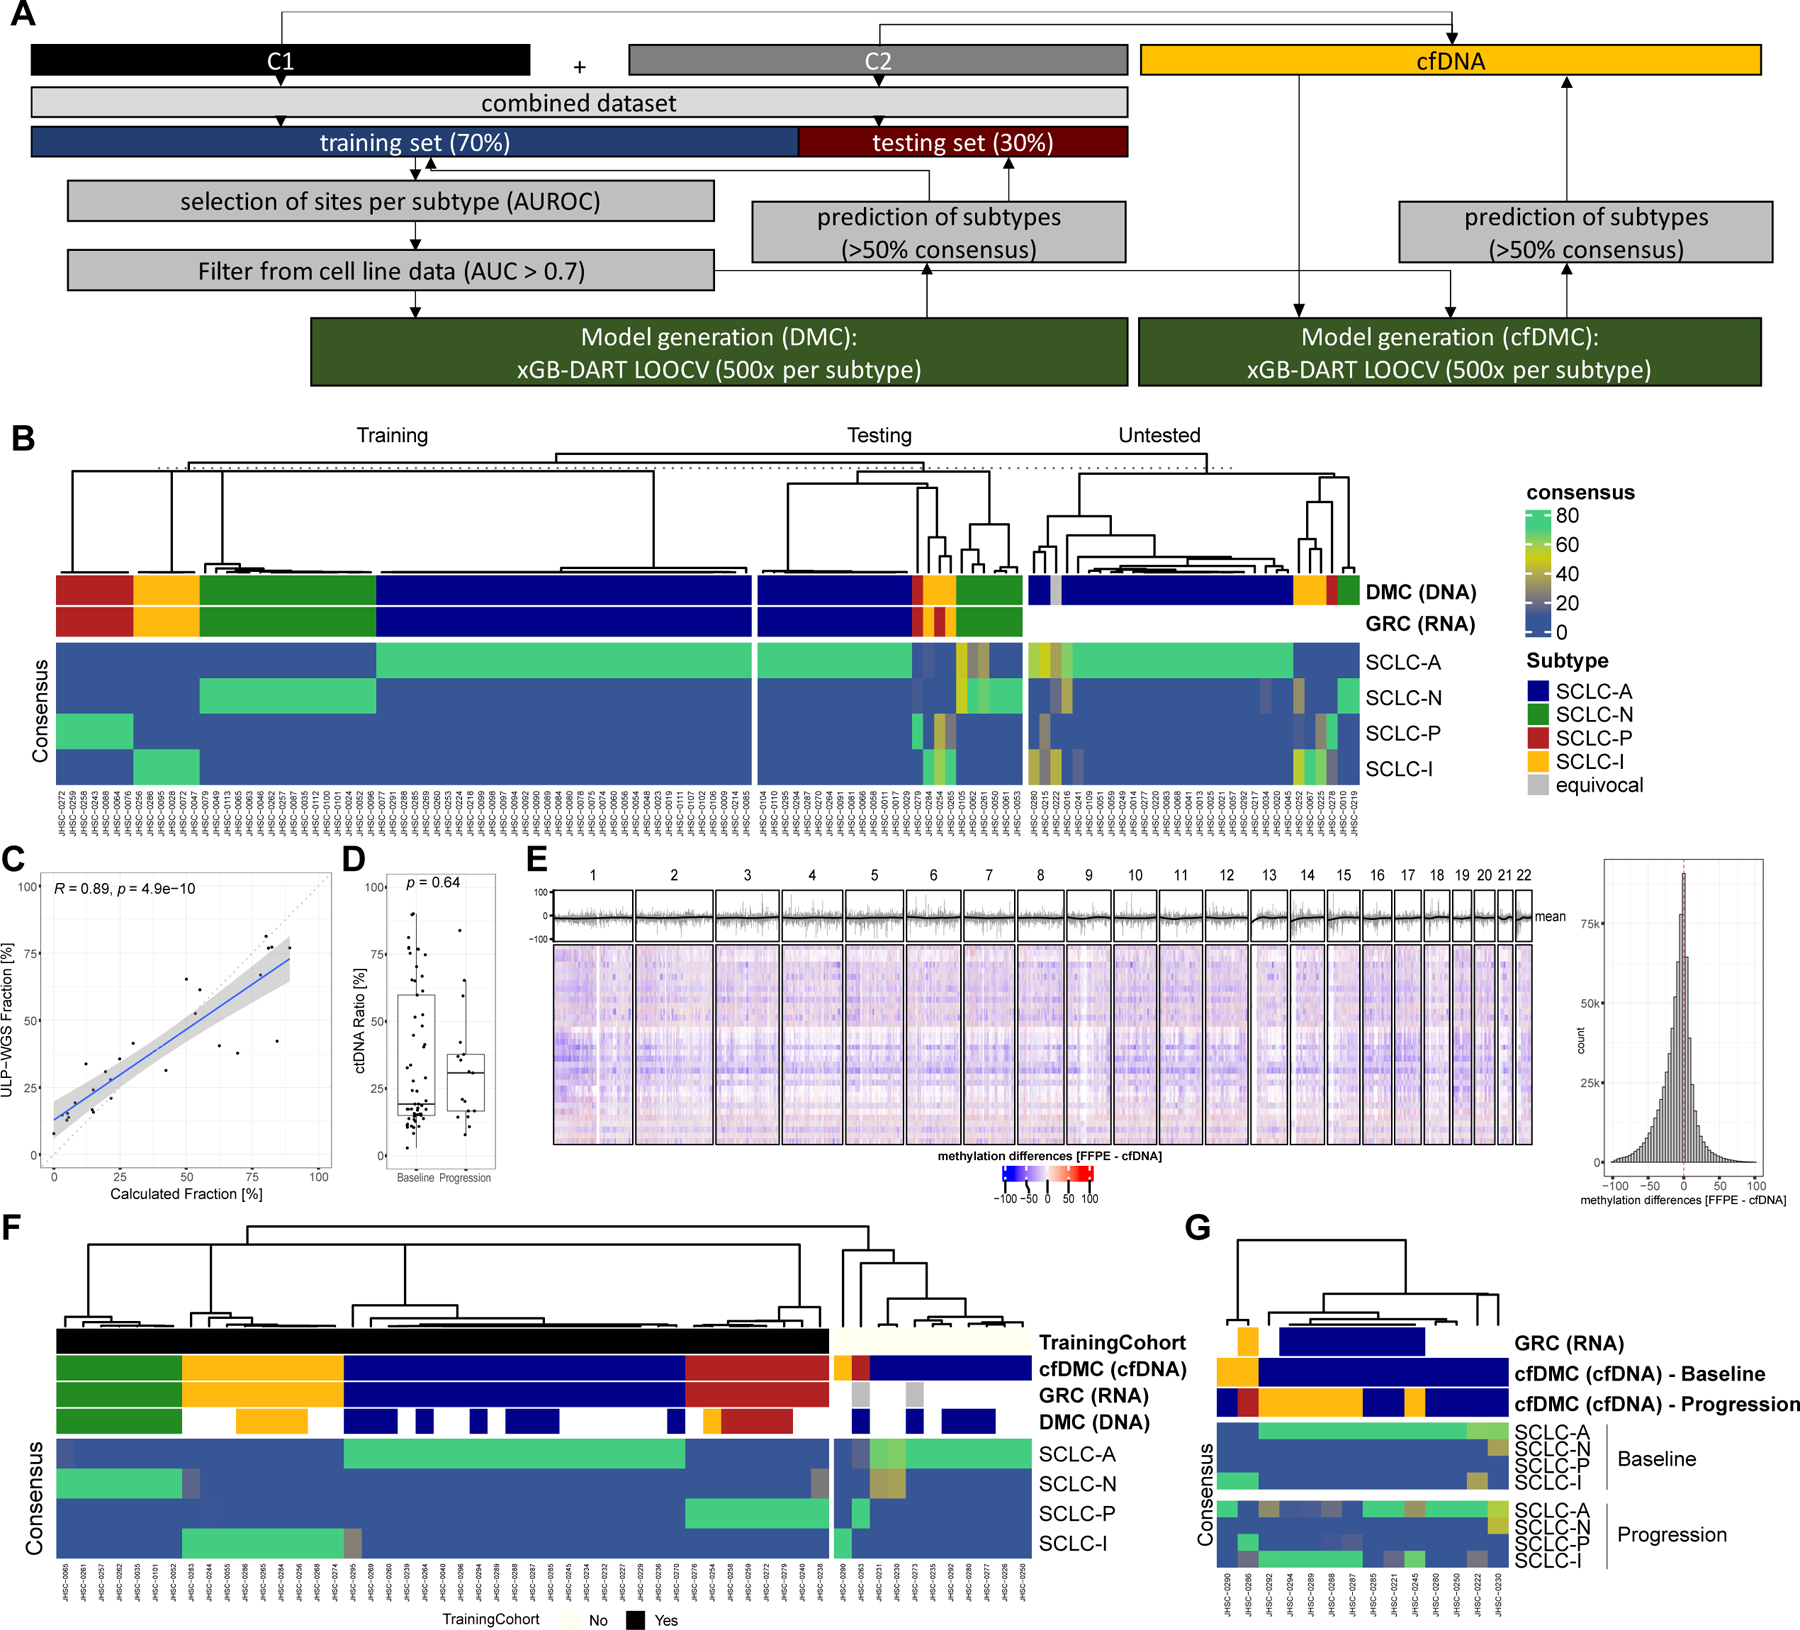
A Scheme describing the process to develop the SCLC DNA methylation classifier (SCLC-DMC). Both cohorts were combined and the dataset was split in a training and a testing set and highly predictive DNA methylation sites were selected using area under the receiver operator characteristics curve (AUROC) to create predictive models using extreme gradient boosting with Dropouts multiple Additive Regression Trees (xGB-DART) with leave one out cross validation (LOOCV). For each subtype, 500 models were individually trained. Performance was assessed on the testing set. A cfDNA adjusted consensus classification approach (SCLC-cfDMC) was created using the same DNA methylation sites as used for the SCLC-DMC to predict subtypes in liquid biopsies. B Classification of SCLC tissue specimen using the SCLC-DMC approach. Prediction of subtype is shown in the training set, the independent testing set as well as in samples were classification by RNA (GRC) was not possible due to the absence of RNA-seq data (untested). The consensus in percentage of agreement between the models is shown. C Correlation of computed circulating tumor DNA (ctDNA) fraction by ultra-low pass whole genome sequencing (ULP-WGS) and a classifier based on seven methylation sites (Calculated Fraction [%]). D Differences in ctDNA fraction per DNA methylation were compared between samples analyzed at baseline prior to treatment and samples at tumor progression. E Differences in genome-wide DNA methylation between tumor tissue samples and matched baseline plasma samples were compared. DNA methylation was averaged per sample and subtype over 100kbp bins and changes between tumor DNA methylation and plasma DNA methylation were analyzed for each 100kb bin for each patient represented by a row in the heatmap across each chromosome as highlighted above. Furthermore, mean methylation per bin across the samples is highlighted in grey color above the heatmap together with the rolling average depicted by a black line. A histogram to the right highlights the distribution of differences for each bin across all samples. F The classification of SCLC subtypes using the SCLC-cfDMA approach is shown in plasma sample taken at baseline prior to treatment. Additionally, to the consensus, the classification based on the gene-ratio approach (GRC) as well as based on the tissue DMC approach is shown. Samples with GRC classification were included in the training cohort and inclusion for each sample is shown. G Classification of SCLC-subtypes using the SCLC-cfDMC approach is shown for samples with matched baseline plasma and plasma at progression. Boxplot shows the median as thick line, the box highlighting the first and third quartile with the whiskers highlighting 1.5x the interquartile range. Wilcoxon test was used to compute p-values between groups.
See also Figures S6-9 and Table S3.