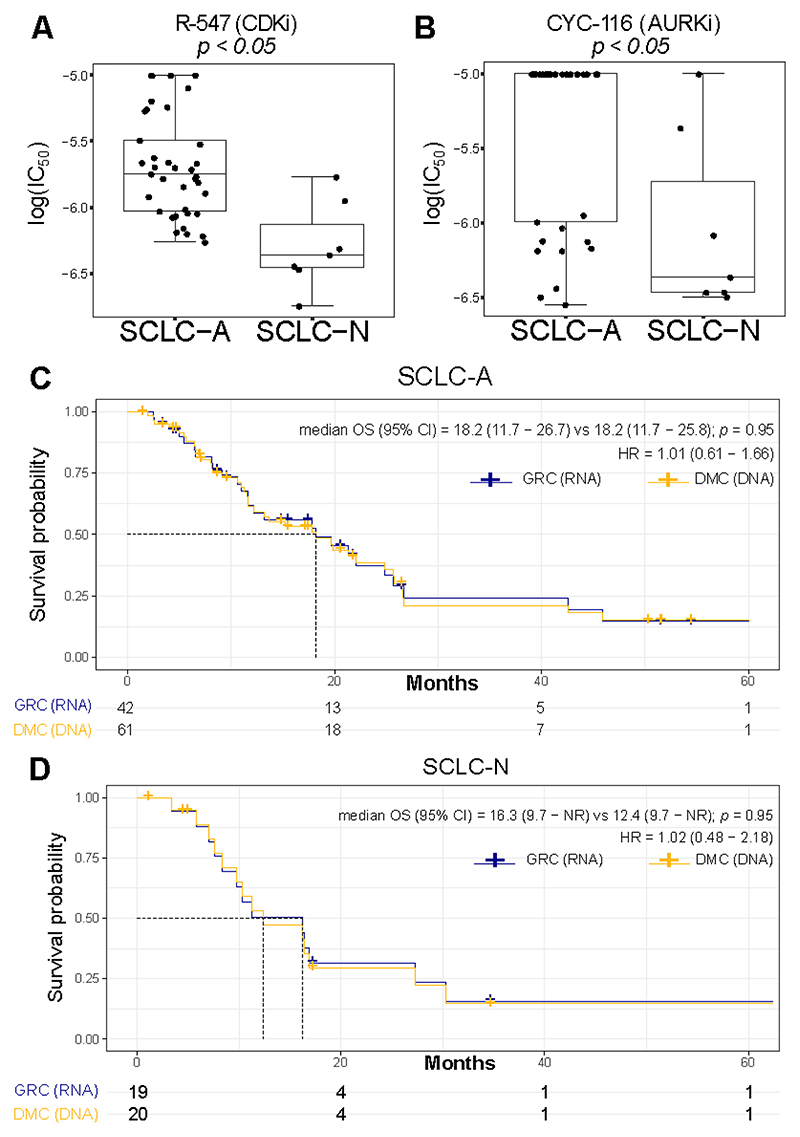
Figure 4. Influence of SCLC subtyping methods on in vitro drug screening and clinical outcome.
Comparison of IC50 values for the A CDKi R-547 and the B AURKi CYC-116 between cell lines assigned to SCLC-A and SCLC-N using SCLC-DMC. C-D Clinical outcome depending on classification method used. Overall survival of SCLC patients stratified by classification using the SCLC-GRC (RNA-seq) and SCLC-DMC (DNA Methylation) method for C SCLC-A and D SCLC-N. Statistical significance is calculated using log-rank test. Cox-proportional hazard ratio is calculated and shown with 95% confidence interval. Boxplot shows the median as thick line, the box highlighting the first and third quartile with the whiskers highlighting 1.5x the interquartile range. Wilcoxon test was used to compute p-values between groups.

