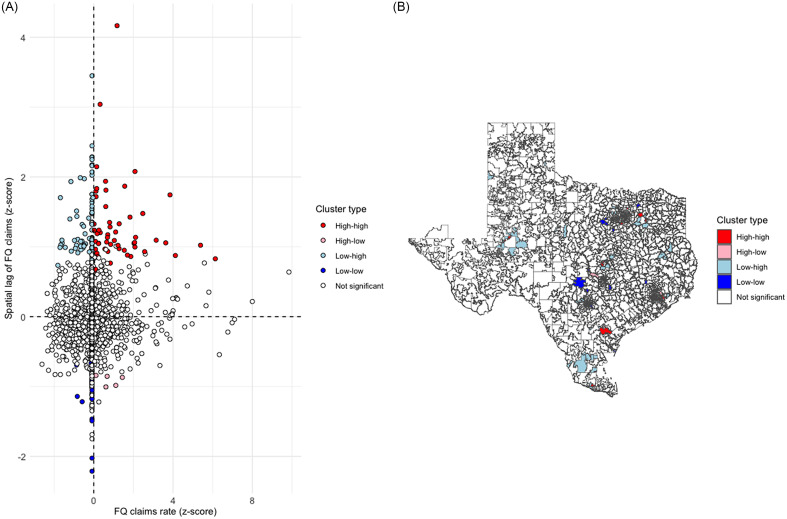
Figure 2.
Spatial distribution and empirical Bayes ZCTA clusters of fluoroquinolone claim rates in Texas. A- LISA Quadrant Scatter Plot B- LISA Cluster Map. The distribution included 55 high-high, 5 high-low, 73 low-high, 20 low-low, and 1775 non-significant clusters. LISA, Local Indicators of Spatial Association; ZCTA, ZIP Code Tabulation Areas; FQ, Fluoroquinolones.

