

Summary
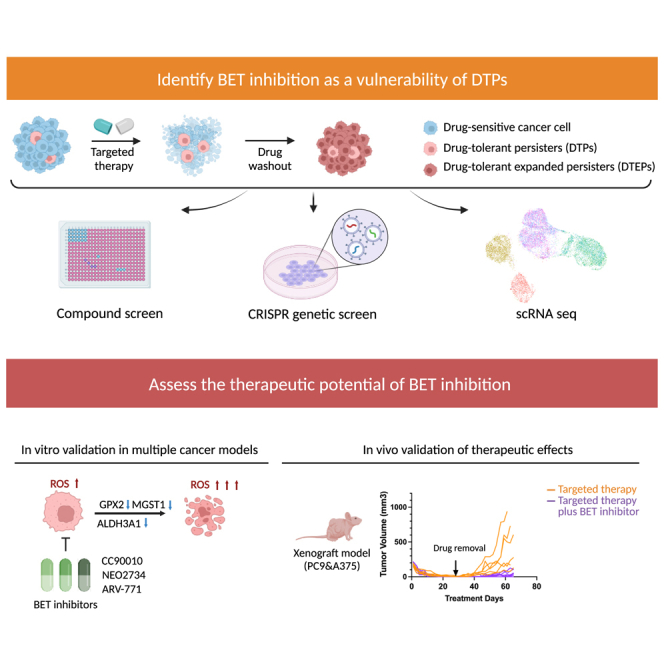
Drug-tolerant persisters (DTPs) are a rare subpopulation of cells within a tumor that can survive therapy through nongenetic adaptive mechanisms to develop relapse and repopulate the tumor following drug withdrawal. Using a cancer cell line with an engineered suicide switch to kill proliferating cells, we perform both genetic screens and compound screens to identify the inhibition of bromodomain and extraterminal domain (BET) proteins as a selective vulnerability of DTPs. BET inhibitors are especially detrimental to DTPs that have reentered the cell cycle (DTEPs) in a broad spectrum of cancer types. Mechanistically, BET inhibition induces lethal levels of ROS through the suppression of redox-regulating genes highly expressed in DTPs, including GPX2, ALDH3A1, and MGST1. In vivo BET inhibitor treatment delays tumor relapse in both melanoma and lung cancer. Our study suggests that combining standard of care therapy with BET inhibitors to eliminate residual persister cells is a promising therapeutic strategy.
Graphical abstract
Highlights
-
•
Unbiased genetic screen and compound screen identify BRD2 as a vulnerability of DTPs
-
•
BET inhibitors suppress outgrowth of DTPs in a broad spectrum of cancer types
-
•
BET inhibitors suppress DTEPs through transcriptional repression of GPX2/ALDH3A1/MGST1
-
•
BET inhibitors delay tumor relapse
Chen et al. uses high-throughput screening approaches to identify BRD2 inhibition as a vulnerability of drug-tolerant persisters (DTPs). They further demonstrate that BET inhibitors suppress the emergence of DTPs in multiple cancer cell lines in vitro and can forestall drug resistance through the eradication of DTPs in vivo.
Introduction
Drug-tolerant persisters (DTPs) were initially discovered in subpopulations of bacteria that are resistant to antibiotics through non-inheritable mechanisms associated with proliferation pause.1,2 In 2010, the existence of similar rare subpopulations of DTPs were identified in non-small cell lung cancer cell lines that survived lethal dosage of targeted/chemotherapy by entering a noncycling state.3 Slowly cycling DTPs were subsequently identified as having a distinct transcriptomic profile.4 Different from genetic resistance, the drug-tolerant state is reversible as drug-tolerant expanded persisters (DTEPs) gradually regain proliferative capacity after drug withdrawal and regain sensitivity to primary treatment.5 DTPs are thought to serve as a reservoir from which genetic resistant variants can emerge.2,6 Therefore, a better understanding of the selective vulnerabilities of DTPs/DTEPs could enable the development of novel therapeutic strategies.
Since their original discovery in lung cancer, the presence of DTPs has been confirmed in multiple cancer types, including breast cancer, prostate cancer, melanoma, gastric carcinoma, and colon cancer.1,6 Diverse mechanisms have been reported to promote the formation of DTPs. A number of studies support that epigenetic reprogramming, which involves altered histone modifications and promoter region accessibilities, promotes cancer cells to enter this non-genetic and reversible DTP status.2,3,5 In addition, YAP-mediated enhanced expression of anti-apoptotic signaling has been shown to empower DTPs to evade drug-induced apoptosis.7 Also, adaptive activation of inflammatory signaling, including nuclear factor κB (NF-κB), interferon response, and signal transducer and activator of transcription 3 (STAT3) have also been reported to play a role in hampering drug-induced death.8,9 Moreover, DTPs also have features of epithelial-mesenchymal transition (EMT), which is known to be associated with poor drug responsiveness, a senescence-like gene signature, altered metabolic and proteomic profiles, increased reliability on redox regulation, and enhanced stemness.2,7,9,10,11,12 Despite our increasing understanding of DTPs in the last few years, limited efforts have been devoted to translating this concept into novel therapeutic strategies.
Combining a treatment controlling the majority of the cancer population with a second drug targeting DTPs holds the promise to delay or even prevent relapse.13 DTPs have been shown to be vulnerable to ferroptosis induction. However, ferroptosis inducers, including RSL3 and ML210, cannot be used in vivo due to toxicity and/or poor bioavailability. More recently, an aurora kinase B inhibitor was reported to delay relapse, but only in lung cancer.14 Thus, there remains an urgent need for well-tolerated broadly acting agents that selectively eliminate DTPs. Here, by using CRISPR and compound screens, we identify acquired vulnerabilities of DTPs and validate these targets in in vivo models.
Results
Compound screen identifies bromodomain and extraterminal domain (BET) inhibition as a vulnerability of DTPs
We used epidermal growth factor receptor (EGFR) mutant PC9 lung cancer cells treated with gefitinib as a model to study DTPs. Most cancer cell lines are heterogeneous, harboring pre-existing genetically resistant subclones in addition to cells that survive therapy through non-genetic mechanisms. To eliminate cells having pre-existing genetic resistance to therapy, we introduced an activatable suicide switch construct into PC9 cells. This construct encodes a caspase-9 fusion protein that can be induced to dimerize by the addition of a chemical inducer of dimerization (CID), driven by the promoter of the Ki67 gene (PC9-suicide switch cells [PC9-SS]). Because Ki67 is only expressed in proliferating cells, activation of the switch by the addition of CID will eliminate only proliferating cells, allowing for the enrichment of non- or very slow cycling DTPs.15 These PC9-SS cells were treated with a lethal dose of gefitinib for 7 days followed by another 7 days of treatment with both gefitinib and CID to activate the SS. The addition of CID resulted in selective induction of apoptosis in genetically resistant PC9 cells, which proliferate even under continuous treatment with gefitinib (Figure 1A). Different cell morphologies were observed in the remaining DTPs, indicating heterogeneity within this population. After prolonged culture in the absence of drug, DTEPs resembled the original morphology and regained sensitivity to gefitinib treatment as seen in the parental population (Figures S1A and S1B). Bulk RNA sequencing (RNA-seq) of paired DTPs and parental PC9 cells confirmed enrichment of the metastasis EMT signature up in DTPs as previously reported (Figure S1C). Together, the results validate the DTP enrichment method used here.
Figure 1.

Compound screen and CRISPR-based persister screen identified BRD2 as a vulnerability of DTEPs
(A) Schematic representation of DTP induction and generation of DTEPs in PC9-SS cells.
(B) Schematic of small-molecule screen on parental, senescent, DTP, and DTEP cells.
(C) Top hits were selected based on the therapeutic window of senescent (Senes)/DTEP vs. parental. The x axis represents log fold change of the AUC score (Senes/DTEP vs. parental). The y axis represents the AUC score of Senes/DTEP cells.
(D) CellTiter blue quantification of relevant viability of parental cells or DTEPs (osimertinib and gefitinib induced) treated with BET inhibitors.
(E) Schematic of CRISPR-based kinome-wide genetic screen on DTEPs (n = 3 for each arm).
(F) Top hits were selected based on the fold depletion of sgRNAs DTEP vs. parental. Genes with 4 sgRNA dropped out were identified as hits.
(G) Western blot of BRD2 and β-actin in PC9-SS-iCas9 wild-type (WT) and BRD2KO clones.
(H) Relative fold change of persisters number based on cell counting obtained from WT and BRD2KO clones after 14 days of osimertinib exposure.
(I) IncuCyte-based proliferation of DTEPs of WT and BRD2KO clones.
Error bars in (D), (H), and (I) represent mean ± SD, n = 3 independent experiments. Statistical significance was calculated by 2-tailed Student’s t test (∗p ≤ 0.05; ∗∗p ≤ 0.01; ∗∗∗p ≤ 0.001).
It has been shown that DTPs have increased stress levels, which suggests that challenging them with an additional stress could be lethal. We used a stress-focused compound library (agents that target proteotoxic stress, metabolic stress, oxidative stress, DNA damage stress, mitotic stress, and senolytics),16 with the aim of identifying compounds that can be used to eradicate DTPs/DTEPs. Senescent cells share properties with DTPs, suggesting that they may share vulnerabilities. We therefore included four arms in our compound screens: parental proliferating PC9 cells, alisertib-induced senescent cells, gefitinib-induced DTPs maintained in gefitinib, and DTEPs: gefitinib-induced DTPs cultured without gefitinib (Figure 1B). In total, 163 drugs were added to the cells in 15 different concentrations. By calculating the AUC (area under the curve) score we were able to quantify the sensitivity of cells in each treatment condition for individual drugs. As reported before, BCL family inhibitors selectively eliminated both senescent cells and persisters, whereas the ferroptosis inhibitor RSL3 killed PC9 DTEPs (Figure 1C; Table 1).12,17 Using the effect size of RSL3 as a cutoff, we identified the previously reported histone deacetylase inhibitors, and three BET inhibitors, inhibiting bromodomain protein-mediated transcription, as top hits in the DTEP arm. For validation, we generated DTEPs using the EGFR inhibitors gefitinib and osimetinib. Treatment with three different BET inhibitors (NEO2734, ARV-771, and CC90010) selectively decreased the viability of both gefi-DTEPs and osi-DTEPs as compared to their proliferating parental cells (Figure 1D). In summary, the stress-focused compound library screen identified BET inhibitors as a potential therapeutic approach to eliminate persisters.
Table 1.
AUC values of compound screen
| Drug name | Parental | DTP | DTEP | Senescence |
|---|---|---|---|---|
| A-1155463 | 2.96 | 2.06 | 1.49 | 0.33 |
| Navitoclax | 2.23 | 1.08 | 1.4 | 1.19 |
| ARV-771 | 2.99 | 2.7 | 1.77 | 2.73 |
| Neo2743 | 2.92 | 2.55 | 1.98 | 2.55 |
| CC-90010 | 2.79 | 2.56 | 1.93 | 2.71 |
| KNK437 | 3.57 | 3.57 | 3.57 | 2.67 |
| Pracinostat | 1.9 | 0.93 | 1.32 | 2.55 |
| SBI-0206965 | 3.24 | 2.88 | 3.18 | 2.82 |
| GSK2334470 | 3.12 | 2.39 | 2.56 | 3.57 |
| AZD-8055 | 1.61 | 0.9 | 1.05 | 2.1 |
| Geldanamycin | 2.31 | 2.27 | 2.07 | 1.88 |
| Givinostat (hydrochloride monohydrate) | 1.68 | 0.7 | 1.18 | 2.49 |
| Ixazomib | 0.54 | 0.5 | 0.25 | 0.22 |
| Nedisertib | 3.28 | 2.39 | 3.57 | 3.3 |
| BPTES | 3.57 | 3.57 | 3.57 | 3 |
| Vorinostat | 2.42 | 1.54 | 1.79 | 3.38 |
| Fisetin | 2.79 | 2.66 | 2.97 | 2.22 |
| trans-C75 | 2.78 | 2.84 | 2.46 | 2.52 |
| ONC201 | 3.63 | 3.48 | 3.46 | 3.48 |
| APY29 | 2.99 | 3.03 | 2.86 | 2.66 |
| 16F16 | 3.04 | 2.79 | 2.41 | 3.57 |
| Tanespimycin | 0.88 | 0.76 | 0.39 | 1.17 |
| XL 413 | 3.57 | 3.57 | 3.57 | 3.26 |
| PD0166285 | 1.55 | 1.39 | 1.74 | 1.24 |
| Talazoparib | 2.42 | 2.35 | 2.28 | 2.37 |
| Carboplatin | 3.57 | 3.56 | 3.57 | 3.34 |
| Quercetin | 2.46 | 2.4 | 2.9 | 1.88 |
| (S)-Crizotinib | 3.13 | 2.75 | 2.88 | 3.57 |
| Ouabain (octahydrate) | 1.73 | 1.81 | 1.51 | 1.76 |
| 4Ρ8C | 3.57 | 3.57 | 3.57 | 3.57 |
| GSK2656157 | 3.57 | 3.57 | 3.57 | 3.57 |
| MKC3946 | 3.57 | 3.57 | 3.57 | 3.57 |
| Nelfinavir | 3.57 | 3.57 | 3.57 | 3.57 |
| RAD51 inhibitor B02 | 3.57 | 3.57 | 3.57 | 3.57 |
| V-9302 | 2.12 | 2.14 | 1.79 | 2.43 |
| Danusertib | 1.65 | 1.41 | 1.27 | 2.39 |
| Tunicamycin | 2.09 | 1.97 | 2.04 | 2.41 |
| Panobinostat | 0.47 | 0.11 | 0.19 | 1.29 |
| Adavosertib | 1.31 | 1.16 | 1.12 | 1.85 |
| Garcinol | 2.37 | 2.38 | 2.25 | 2.73 |
| AZD-7762 | 1.12 | 1.11 | 1.05 | 1.45 |
| Simurosertib | 1.62 | 1.5 | 1.33 | 2.29 |
| DHEA | 3.02 | 2.87 | 2.97 | 3.57 |
| MK-5108 | 2.13 | 2.1 | 1.82 | 2.86 |
| KW-2478 | 1.68 | 1.73 | 1.97 | 1.74 |
| Sabutoclax | 2.23 | 2.25 | 2.28 | 2.58 |
| PKM2-IN-1 | 2.29 | 2.28 | 2.14 | 2.88 |
| kira6 | 2.72 | 2.38 | 3.28 | 2.95 |
| GSK-923295 | 2.47 | 2.57 | 2.1 | 3.23 |
| Niraparib | 2 | 2.08 | 1.93 | 2.48 |
| AT9283 | 1.2 | 1.15 | 1.03 | 1.93 |
| Oprozomib | 0.56 | 0.76 | 0.45 | 0.99 |
| NCT-503 | 2.98 | 3.57 | 3.1 | 2.81 |
| U-104 | 3.06 | 3.04 | 3.12 | 3.57 |
| D9 | 2.71 | 2.87 | 2.24 | 3.57 |
| IITZ-01 | 1.21 | 0.92 | 0.73 | 2.54 |
| ABT-737 | 2.98 | 2.62 | 3.57 | 3.31 |
| CGK733 | 3.25 | 3.57 | 3.19 | 3.57 |
| 5-Fluorouracil | 2.91 | 3.57 | 2.77 | 3.02 |
| BIIB021 | 1.25 | 1.21 | 1.11 | 2.13 |
| BAY-876 | 2.69 | 2.68 | 2.69 | 3.43 |
| Auranofin | 2.19 | 2.35 | 1.86 | 3.11 |
| KU-60019 | 3.05 | 3.27 | 3.07 | 3.57 |
| Mirin | 2.84 | 2.87 | 2.84 | 3.57 |
| Indisulam | 1.61 | 1.95 | 1.4 | 2.25 |
| Torin 2 | 0.65 | 0.45 | 0.36 | 1.94 |
| OSU-03012 | 2.24 | 2.55 | 2.23 | 2.88 |
| Oxaliplatin | 2.57 | 2.95 | 2.45 | 3.27 |
| DC661 | 1.9 | 2.06 | 1.87 | 2.74 |
| CCT241533 (hydrochloride) | 2.95 | 3.33 | 2.97 | 3.57 |
| MKT 077 | 2.5 | 2.43 | 2.57 | 3.57 |
| Berzosertib | 1.64 | 1.76 | 1.3 | 3.04 |
| CCT245737 | 2.2 | 2.51 | 1.71 | 3.57 |
| Cisplatin | 2.67 | 2.88 | 2.75 | 3.57 |
| BMS-303141 | 2.77 | 3.57 | 2.37 | 3.57 |
| Rabusertib | 1.94 | 2.39 | 1.65 | 2.98 |
| PD 407824 | 2.34 | 2.47 | 2.2 | 3.57 |
| CCF642 | 1.89 | 2.19 | 1.6 | 3.11 |
| Telaglenastat | 1.9 | 2.79 | 1.58 | 2.58 |
| NSC 109555 | 3.15 | 3.57 | 3.57 | 3.57 |
| Doxorubicin (hydrochloride) | 1.37 | 1.41 | 1.2 | 2.97 |
| SCH900776 | 1.47 | 2.01 | 1.17 | 2.7 |
| Daunorubicin (hydrochloride) | 1.24 | 1.41 | 1.05 | 2.78 |
| LY3177833 | 3.04 | 3.57 | 3.57 | 3.57 |
| HA15 | 2.84 | 3.57 | 2.98 | 3.57 |
| Ceralasertib | 2.12 | 2.52 | 1.93 | 3.57 |
| Alisertib | 0.74 | 1.09 | 0.62 | 2.18 |
| GDC-0575 dihydrochloride | 1.12 | 1.66 | 0.67 | 2.71 |
| (E)-Daporinad | 0.29 | 0.74 | 0.5 | 1.37 |
| Barasertib-HQPA | 1.29 | 1.4 | 1.19 | 3.08 |
| Rigosertib | 0.53 | 0.85 | 0.42 | 2.46 |
| Venetoclax | 2.32 | 2.79 | 2.79 | 3.57 |
| BAY-1895344 (hydrochloride) | 0.75 | 1.44 | 0.66 | 2.41 |
| GSK-1070916 | 0.4 | 0.73 | 0.3 | 2.75 |
| CMPD1 | 1.88 | 2.56 | 2.11 | 3.57 |
| GSK2194069 | 2.54 | 3.57 | 3.57 | 3.09 |
| Empesertib | 1.05 | 1.38 | 0.88 | 3.57 |
| Volasertib | 0.32 | 0.55 | 0.23 | 3.57 |
| (−)-Epigallocatechin gallate | 2.9 | NA | 3.15 | NA |
| (S)-Monastrol | 2.85 | 2.85 | 2.52 | NA |
| 3-AP | 3.12 | 3.08 | 3.12 | NA |
| 5-Azacytidine | 2.41 | 3.57 | 2.49 | NA |
| 5-Methyl-1H-pyrazol-3(2H)-one | 3.57 | 3.26 | NA | NA |
| A-485 | 2.49 | 2.04 | 2.53 | NA |
| Acetazolamide | NA | 3.56 | 3.57 | NA |
| Alvespimycin (hydrochloride) | 0.25 | NA | NA | 1.14 |
| AMG 900 | NA | NA | NA | NA |
| Apcin | 3.57 | 3.57 | NA | 3.57 |
| AZD-5991 | 3.29 | 1.15 | 3.57 | NA |
| AZD0156 | 3.57 | 2.76 | 2.79 | NA |
| AZD1390 | 3.57 | 3.57 | 2.59 | NA |
| AZD3965 | 3.57 | 3.57 | NA | 3.57 |
| Bafilomycin A1 | NA | NA | NA | NA |
| BAY1217389 | 0 | NA | NA | 3.57 |
| BI 2536 | NA | NA | NA | 3.57 |
| BML-277 | 3.05 | 2.98 | 2.65 | NA |
| Bortezomib | NA | NA | NA | NA |
| Carfilzomib | NA | 0.05 | 0 | 1.06 |
| Cariporide | 3.57 | 3.57 | NA | 3.57 |
| Chloroquine (diphosphate) | NA | 3.57 | 3.57 | 3.57 |
| Daidzin | 3.57 | NA | 3.54 | NA |
| Dapagliflozin | 3.57 | NA | 3.57 | 2.05 |
| Decitabine | 1.49 | 2 | 0.58 | NA |
| Devimistat | 3.34 | NA | 3.57 | 2.7 |
| DTP3 (TFA) | 3.57 | 3.57 | NA | NA |
| Enasidenib | 3.38 | 3.57 | 3.57 | NA |
| Epothilone B | NA | NA | 0 | NA |
| Etoposide | 2.16 | 2.31 | 1.98 | NA |
| Filanesib | 0 | NA | NA | 2.59 |
| Gemcitabine | NA | 1.27 | NA | NA |
| GSK2606414 | 3.57 | 3.57 | NA | 3.57 |
| GSK461364 | NA | NA | NA | 2.28 |
| Hydroxychloroquine sulfate | 3.57 | NA | NA | NA |
| IACS-10759 | 0.84 | NA | 0.75 | 0.21 |
| IPI-3063 | 3.36 | 2.89 | 3.42 | NA |
| Ispinesib | NA | NA | NA | 2.74 |
| ISRIB (trans-isomer) | 3.57 | 3.57 | 3.57 | NA |
| l-Buthionine-(S) | 2 | 3.57 | 3.57 | 3.57 |
| Litronesib | 0 | NA | NA | NA |
| Luminespib | NA | NA | 0 | 0.39 |
| Marizomib | NA | NA | NA | NA |
| MRT68921 (dihydrochloride) | 2.5 | 3.05 | 2.2 | NA |
| ND 646 | 2.68 | NA | 3.57 | NA |
| Olaparib | 3.07 | 2.88 | 3.57 | NA |
| Paclitaxel | NA | NA | NA | 1.55 |
| pevonedistat (MLN4924) | 1.86 | 1.86 | 1.67 | NA |
| PF 3644022 | 3.57 | 2.45 | 3.07 | NA |
| Prexasertib | NA | NA | 0 | NA |
| ProTAME | 3.1 | 3.57 | 3.57 | NA |
| PX-12 | 3.24 | NA | 2.99 | NA |
| QNZ | 0.92 | 2.32 | NA | 1.2 |
| Quisinostat | NA | 0.31 | NA | 1.24 |
| Rapamycin | 2.33 | 1.7 | 1.86 | NA |
| RI-1 | NA | NA | 3.57 | NA |
| Romidepsin | 2.07 | NA | 0 | 0 |
| RSL3 | 2.53 | 2.18 | 1.7 | NA |
| Rucaparib | 3.42 | 3.57 | NA | 3.57 |
| SB-743921 | NA | NA | NA | 2.73 |
| SC75741 | 2.33 | 2.61 | 2.32 | NA |
| STF-083010 | NA | NA | 3.57 | NA |
| TH588 | 3.4 | 3.52 | 3.57 | NA |
| Thapsigargin | NA | NA | 0 | NA |
| Tozasertib | 1.33 | 1.32 | 1.05 | NA |
| ULK-101 | 3.57 | NA | 3.57 | NA |
| Vinblastine (sulfate) | NA | NA | 0 | 1.68 |
| Vincristine (sulfate) | NA | NA | NA | 2.07 |
| VX 984 (M9831) | 3.51 | 3.57 | 3.57 | NA |
| YM-155 | NA | NA | NA | 0.15 |
CRISPR-based persister screen identifies bromodomain-containing protein 2 (BRD2) as a vulnerability of DTEPs
To complement the small-molecule screen and to identify genes essential for the survival of persisters, we performed a loss-of-function genetic screen using the doxycycline-inducible CRISPR-Cas9 vector system in PC9-SS cells.18 Due to the rareness of persisters and their consequential small numbers, we choose to use a kinome-scale library for this screen. In short, we established PC9-SS cells stably expressing doxycycline-inducible Cas9 (PC9-SS-iCAS9) (Figures S2A–S2C). The lentiviral-kinome single-guide RNA (sgRNA) library was transduced into proliferating PC9-SS-iCas9 cells followed by selection with puromycin for lentiviral integration. As described above, sgRNA-expressing PC9-SS-iCas9 cells were treated with gefitinib and CID for DTP induction and enrichment. After this, doxycycline was added to activate the Cas9-mediated genome editing (Figure 1E). Persisters were cultured for 10 days in doxycycline-containing medium without gefitinib to allow the depletion of cells containing sgRNAs targeting genes required for DTEP survival. Proliferating cells were used as a control in this screen. By identifying the sgRNAs specifically depleted in DTEPs as compared to proliferating cells, we identified vulnerabilities of DTEPs. Based on this criterion, the BET domain containing protein BRD2 was identified as a top hit in the genetic screen (Figure 1F). Two BRD2 knockout clonal PC9 cell lines were established for validation (Figure 1G). Knockout of BRD2 dramatically decreased the number of DTPs that survived osimertinib treatment (Figure 1H). Although the loss of BRD2 has hardly any effect on parental PC9 cell proliferation, it abolished the outgrowth of DTEPs in both IncuCyte proliferation assays and colony-formation assays (Figures 1I, S2D, and S2E). At this moment, there are no specific inhibitors for individual members of the BET family of proteins. To address in more detail which BET proteins are vulnerabilities of DTPs, individual knockdown of BRD2, BRD3, and BRD4 were performed in both EGFR mutant PC9 and BRAF mutant A375 to investigate their potential functions in DTP regulations. Bromodomain testis-specific protein was excluded from this experiment because it has been reported to be expressed in testis only, which is also confirmed in our RNA-seq data, given the limited read counts (<10) detected. Of note, BRD2 was the most abundantly expressed in PC9 as compared to the other BET proteins (Figure S3A). Among the three BET proteins we tested, BRD2 knockdown drastically suppressed the formation of DTPs in both PC9 and A375, whereas BRD3 knockdown has a minor/moderate effect on DTP emergency. Surprisingly, BRD4 knockdown confers resistance to osimertinib treatment as reflected by an increased number of DTPs surviving after 14 days of drug exposure (Figures S3B–S3E). Our findings on BRD4 are consistent with a recently published study on the embryonic-like diapause-like adaption that promoted tumor persistence associated with MYC suppression.19 In the study, pharmacological suppression of BRD proteins with JQ1-induced diapause-like profiles and reduced the effect of cytotoxic treatment in cancer cells.20,21 The overlap between the CRISPR screen and compound screen identifying BET proteins as vulnerabilities of persister cells highlights that the inhibition of BET proteins can serve as a promising strategy to selectively target DTEPs.
To further study the effects of BET inhibition on the proliferation of both parental PC9-SS cells and their DTEPs, we used IncuCyte live cell imaging to study cell proliferation. As reported before, DTEPs induced in our system indeed exhibit a much slower proliferation rate as judged by both IncuCyte- and long-term colony-formation assays (Figures 2A and S4). BET inhibitors abolished DTP outgrowth into DTEPs while having minor effects on proliferating cells (Figures 2A and S4). Moreover, upon treatment with BET inhibitors, we observed a strong increase in the percentage of apoptotic cells in DTEPs as measured by caspase-3/-7-activated dye, accompanied by fragmentation into apoptotic bodies, indicating BET inhibitor-induced apoptotic cell death (Figure 2B).
Figure 2.

BET inhibition selectively triggered apoptotic cell death in EGFR inhibition (EGFRi)-induced persisters in lung cancer and eliminated DTEPs in a broad spectrum of cancer types
(A) IncuCyte-based proliferation of parental and DTEPs treated with BET inhibitors (n = 3).
(B) Caspase-3/-7 staining images and quantification of parental PC9 cells and DTEPs treated with BET inhibitors or DMSO at 72 h. Black scale bar, 100 μm.
(C) CellTiter blue quantification of relevant viability of parental cells or DTEPs (A375, GTL-16, and H358) treated with BET inhibitors.
(D) IncuCyte-based proliferation of parental and DTEPs (A375, GTL-16, and H358) treated with NEO2734.
Error bars in (A)–(D) represent mean ± SD, n = 3 independent experiments. Statistical significance was calculated by 2-tailed Student’s t test (∗p ≤ 0.05; ∗∗p ≤ 0.01; ∗∗∗p ≤ 0.001).
BET inhibition eliminates DTEPs of a range of cancer types
We next investigated the effect of BET inhibition in several different tumor models, including A375 BRAF mutant melanoma, GTL-16 MET-amplified gastric carcinoma, and H358 KRASG12C mutant lung cancer cells, which were turned into DTPs by treatment with dabrafenib plus trametinib, the MET inhibitor crizotinib, and the KRASG12C inhibitor AMG510, respectively. BET inhibitor treatment of DTEPs derived from these three additional models was consistently lethal as reflected by IncuCyte proliferation assay and long-term colony-formation assay (Figures 2C, 2D, S4, and S5). Again, persisters derived from these cancer cell lines exhibited a slow proliferation rate and regained sensitivity to primary treatment after drug removal (Figures 2C and S1D). For all four models, we also tested RSL3 (GPX4 inhibitor) and ABT263 (BCL family inhibitor) with established activity toward DTPs. ABT263 only suppressed osi-DTEPs in PC9. No therapeutic window was observed for RSL3 in H358 G12C mutant lung cancer cells (Figure S6). Together, these findings support the observation that BET inhibitors suppressed DTEPs in a broader spectrum of cancer types than the presently identified drugs.
Single-cell RNA-seq (scRNA-seq) uncovers distinct transcriptomic landscapes in parental, DTP, and DTEP cells
To gain insight into the heterogeneity of persisters and to investigate the mechanism underlying the selective sensitivity of DTEPs to BET inhibition, we performed scRNA-seq. Seurat clustering and Dimplots were applied to identify the different clusters and visualization of the dimensional reduction. We compared single cells from four conditions: parental PC9, DTPs, DTEPs, and DTEPs treated with BET inhibitor. scRNA clustering uncovered distinct transcriptomic landscapes for parental, DTP, DTEP, and DTEP treated with NEO2734 (Figures 3A and S7; Table S1). DTPs are arrested in their cell cycle, whereas drug removal enables them to re-enter the cell cycle. BET inhibitor treatment increased the cell-cycle arrest in persisters (Figures 3A and 3B). The effect of BET inhibition on persisters could be confirmed further by the dynamic changes in MYC and E2F targets and apoptosis gene signaling in different clusters and decreased cell percentage arrested in G2/M (Figures 3A–3C and S7B).
Figure 3.

scRNA-seq uncovered distinct transcriptomic landscapes in parental, DTP, and DTEP cells
(A) Uniform manifold approximation and projection (UMAP) representation of scRNA-seq on parental, DTP, DTEP-untreated (DTEP-UN), and DTEP-treated with NEO2734 (DTEP-TR). Cells are colored based on different treatment conditions (left). Cells are colored based on different cell-cycle stages (right). (For DTEP-UN and DTEP/TR, samples were collected at 24 h [T1] and 48 h [T2]. T1 and T2 were analyzed as duplicates).
(B) Quantifications of cell-cycle phase for cells in parental, DTP, DTEP-UN, and DTEP-TR.
(C) Comparison of Myc targets module scores on parental, DTP, DTEP-UN, and DTEP-TR.
(D) UMAP presentations of 5 clusters identified within DTPs. (Left) UMAP representations of cycling and noncycling counterparts within DTPs. (Right) Cycling: G2; noncycling: G1 and S).
(E and F) Heatmap summary of representative gene signatures (Hallmark [E] and KEGG [F]) for different clusters within the DTP subset. Color bar indicates −log10 p value.
In addition, scRNA seq confirmed the increase in stemness features reflected by the enrichment of hedgehog signaling (Figure S7C). Other previously reported biological features such as increases in reactive oxygen species (ROS) and active inflammatory responses, including interleukin-6-Janus kinase-STAT3 (IL-6-JAK-STAT3) signaling, interferon-α, and interferon-γ, were also enriched in DTPs (Figure S7C). To address whether different subpopulations exist within persisters, we performed Seurat clustering focusing on the DTP group only (Figures 3D–3F). In total, five clusters of DTPs were identified with subtle differences (Figure 3D). Analysis of their cell-cycle status showed that clusters 0, 1, and 3 belong to non-cycling persisters, whereas cycling persisters are present in clusters 2 and 4 (Figure 3D). Cluster 0 was marked by the enrichment of inflammatory signaling, including IL-2-STAT5 signaling, altered metabolism of choline metabolism in cancer, and enhanced stemness features reflected by notch signaling. Cluster 1 DTPs were marked by altered cellular metabolism, including ferroptosis and glutathione metabolism and protein synthesis reflected by mammalian target of rapamycin (mTOR) complex 1 signaling. This also supports the notion that non-cycling persisters are more vulnerable to ferroptosis inhibition.4 EMT, coagulation, extracellular matrix-receptor interaction, and focal adhesion signaling were enriched in non-cycling persisters of cluster 3, indicating that these subpopulation of persisters may share a distinct cellular morphology. For the cycling persisters clusters 2 and 4, the common signaling features compared to non-cycling counterparts were cell-cycle-associated pathways, including E2F targets, G2M checkpoints, and DNA replication. Moreover, cluster 2 cycling persisters were marked by pyrimidine metabolism, and cluster 4 was marked by mismatch repair and homologous recombination. Analysis of their most representative hallmarks uncovered distinct biological features of the clusters, pointing at the complexity of DTPs even when derived from the same cancer type (Figures 3E and 3F).
To investigate the similarity among persisters with different tissue origins, transcriptome analysis was performed in four paired DTPs vs. parental cells. Pathway analysis (Hallmark gene sets and Kyoto Encyclopedia of Genes and Genomes [KEGG] gene sets) of differentially expressed genes in persisters as compared to parental proliferating cells uncovered their distinct biological features (Figure S8). As reported, DTPs are in a cell-cycle-arrested state as reflected by the suppression of both MYC and E2F targets. Ribosome, aminoacyl tRNA biosynthesis, and mTOR signaling are suppressed in DTPs as well, indicating that non-essential translation processes were less active in persisters.22 Glycolysis was suppressed while enrichment was observed in bile acid metabolism, fatty acid metabolism, and adipogenesis, confirming altered metabolism in DTPs.11,23 Apart from H358, in PC9, A375, and GTL-16, enrichment was also observed in gene sets, including inflammatory response, IL6-JAK-STAT3 signaling, and tumor necrosis factor-α signaling via NF-κB, interferon-γ, and interferon-α response, raising the possibility that active inflammation signaling may contribute to the suppression of drug responses in persisters. Other established features of persisters, including apoptosis, ROS pathway, and EMT transition, were also observed consistently by RNA-seq.10 To comprehensively investigate the difference of persisters derived from multiple cancer origins, we defined each signature enrichment score as a characteristic of every DTP dataset and calculated the distance between every pair of two samples based on the average value of differences over all characteristics (Table S2; see STAR Methods). The average distance of H358-DTPs gene signature to the three other DTPs is the longest observed, indicating the dissimilarity of H358-DTPs to the other DTPs (Figure S8C).
DTPs share some features with senescent cells but have different vulnerabilities
Previously, it was reported that a senescence-like dormant state can be triggered in PC9 cells by the combination of EGFR and MEK inhibition.7 Consistent with these findings, DTPs with an enriched senescence signature were found in clusters 0, 1, and 2 based on our scRNA data (Figure S9A). In addition, we observed enrichment of the FRIDMAN senescence gene signature in our bulk RNA-seq data (Figure S9B). Moreover, the similarities between persisters and senescent cells are further supported by the observation that a fraction of the persisters stained positive for senescence-associated β-galactosidase (Figure S9C).
Previously, our group reported that the inhibitor of extrinsic apoptosis signaling cFLIP is a vulnerability of senescent cancer cells and that the DR5 agonist conatumumab is a broadly acting senolytic agent.18 However, in the context of persister cancer cells, the overexpression of cFLIP did not have an effect on the emergence of DTPs and could only partially rescue the killing of DTEPs by BET inhibitors (Figures S9D and S9E). Moreover, alisertib-induced senescent cancer cells are more vulnerable to conatumumab as compared to persisters (Figure S9F). Transcriptomic analysis also suggested that NF-κB targets are selectively increased in persisters compared to senescent cells (Figure S9G). Collectively, these data indicate that despite the similarity of persisters and senescent cells in some aspects, they display distinct vulnerabilities. Moreover, the mRNA expression of BRD2, BRD3, and BRD4 remained unchanged in DTPs, indicating that the suppressive effect of BET inhibitors on persisters cannot be attributed to increased BRD protein expression (Figure S3A).
scRNA-seq identifies lethal levels of ROS in DTEPs after BET inhibition
Most interesting with respect to the observed sensitivity of DTEPs to BET inhibitors, we also observed dynamic changes of ROS gene sets in different clusters (Figure 4A). Recently, redox homeostasis has been implicated in features of DTP cells, including epigenetic regulation of slow cell proliferation status, adaptive metabolism alteration, and tumor cell plasticity.24 In line with this notion, ROS signaling was increased during DTP formation and decreased again after drug washout and when DTPs started to proliferate into DTEPs. DTEPs treated with BET inhibitors failed to alleviate ROS levels, leading to the hypothesis that BET inhibition may eliminate DTEPs by increasing the intracellular ROS to a lethal level. Flow cytometry-based staining enabled us to quantify ROS levels in different conditions. Increased intracellular ROS levels were observed in both lung cancer and melanoma DTPs (Figures 4B and 4C). The intracellular ROS level dropped in DTEPs, whereas treatment with both the known ROS inducer RSL3 and NEO2734 increased ROS levels in DTEPs (Figures 4B and 4C). Moreover, the addition of a general ROS scavenger, N-acetylcysteine (NAC), rescued DTEPs from BET inhibitors, further supporting that the lethal effect BET inhibitors have on DTEPs can be attributed to increased ROS levels in DTEPs (Figure 4D, left panel). Similar results were obtained from A375 melanoma cells and GTL-16 gastric cancer cells (Figures 4E, S10, and S11). Consistently, BRD2 knockdown also increases ROS levels in DTPs in both PC9-SS and A375 cells (Figures S10C and S10D). Previously DTPs were reported to be vulnerable to ferroptosis induction.17 To investigate which type of cell death was induced by BET inhibition, we performed rescue experiments using a ferroptosis inhibitor ferrostatin and an apoptosis inhibitor, Z-VAD-FMK. In PC9, Z-VAD-FMK partially rescued DTEPs from BET inhibition, whereas ferrostatin had no effect, supporting the induction of apoptosis in PC9 DTEPs upon treatment with BET inhibitors (Figure 4D, center and right panels). In A375 and GTL16, both Z-VAD-FMK and ferrostatin could partially rescue the inhibitory effect of BET inhibitors on DTEPs, indicating that different types of cell death were induced in these two models (Figures 4E and S11). Regarding H358-derived DTPs, BET inhibition failed to increase the ROS level (Figure S10). We also failed to observe a selective toxicity of DTPs to RSL3 (Figure S6). The different phenotypes observed here suggest that H358-DTPs may share fewer similarities with the DTPs derived from other cancer types, which was also supported by the heatmap analysis of the difference in biological features among four paired DTPs vs. parental samples (Figure S8C). The suppressive effects of BET inhibition on H358-DTPs may be attributed to the targeting of other vulnerabilities apart from ROS induction. The data shown above highlight the complexity and heterogeneity of DTPs from different tissue origins.
Figure 4.

scRNA-seq identified lethal levels of ROS in DTEPs after BET inhibition
(A) Comparison of ROS pathway gene signature module scores on parental, DTP, DTEP-UN, and DTEP-TR.
(B and C) Flow cytometry-based quantification of intracellular ROS level (mean fluorescent intensity) in on parental, DTP, DTEP-UN, and DTEP-TR in both PC9 (B) and A375 (C) cells. (Samples collected at 72 h, NEO2734: 0.25 μM).
(D and E) Relative cell viability of DTEPs exposure to BET inhibitors with or without NAC, ferrostatin, and Z-VAD-FMK (NEO2734: 0.25 μM; NAC: 2.5 mM; ferrostatin: 2.5 μM; Z-VAD-FMK: 10 μM).
Error bars in (B)–(E) represent mean ± SD, n = 3 independent experiments. Statistical significance was calculated by 2-tailed Student’s t test (ns, not significant; ∗p ≤ 0.05; ∗∗p ≤ 0.01; ∗∗∗p ≤ 0.001).
BET inhibition suppresses DTEPs through inhibiting anti-oxidative DTP markers, including glutathione peroxidase 2 (GPX2), microsomal glutathione S-transferase 1 (MGST1), and aldehyde dehydrogenase 3 family member A1 (ALDH3A1)
To investigate the mechanism by which BET inhibition induces ROS accumulation, we focused on DTP markers differentially expressed among identified Seurat clusters. Pathway analysis of downregulated markers in DTEPs upon NEO2734 treatment identified their potential function in regulating cellular response to oxidative stress, cell motility, cell growth, extracellular matrix organization, and response to xenobiotic stimulus (Figures 5A and 5B). Consistent with our observations of further ROS induction in DTEPs upon treatment with BET inhibitors, three DTP markers with well-established anti-oxidative functions, including GPX2, ALDH3A1, and MGST1, were strongly suppressed upon treatment with NEO2734 (Figures 5A, 5C, and 5D).4,25,26 Stable knockdown of GPX2, MGST1, and ALDH3A1 significantly suppressed persister emergence and sensitized DTEPs to BET inhibition (Figures 5E and 5F). Moreover, increased ROS levels were observed in DTPs derived from GPX2, MGST1, and ALDH3A1 PC9 cells (Figure S12). In summary, our results suggest that BET inhibition kills DTEPs by inhibiting anti-oxidative DTP markers, including GPX2, MGST1, and ALDH3A1, thereby creating lethal ROS levels.
Figure 5.

BET inhibition suppressed DTEPs through inhibiting antioxidative DTP markers, including GPX2, MGST1, and ALDH3A1
(A) Differentially expressed DTP markers in NEO2734 treated vs. untreated DTEPs. X axis: log2 fold change (DTEP-TR/DTEP-UN) based on bulk RNA-seq data; y axis: average difference calculated based on scRNA-seq data. Blue: downregulated; red: upregulated.
(B) Gene Ontology term enrichment analysis of 17 DTP markers downregulated upon NEO2734 challenged in DTEPs identified in Figure 4A.
(C) UMAP representation of GPX2, ALDH3A1, and MGST1 expressions in parental, DTP, DTEP-UN, and DTEP-TR. Color scale indicates the log2 counts per million per cell.
(D) Violin plots for GPX2, ALDH3A1, and MGST1 normalized reads in individual cells in parental, DTP, DTEP-UN, and DTEP-TR.
(E) Relative fold change of persisters number obtained from GPX2, ALDH3A1, and MGST1 knockdown cells after 14 days of osimertinib and CID exposure. pLKO empty vector-infected cells were used as a control.
(F) Relative cell viability of DTEPs upon treatment with NEO2734 (0.05 μM). DTEPs were derived from pLKO, GPX2, ALDH3A1, and MGST1 knockdown cells. pLKO empty vector-infected cells were used as a control.
Error bars in (E) and (F) represent mean ± SD, n = 3 independent experiments. Statistical significance was calculated by 2-tailed Student’s t test (∗p ≤ 0.05; ∗∗p ≤ 0.01; ∗∗∗p ≤ 0.001).
BET inhibition suppresses DTEPs and delays tumor relapse in vivo
To date, most studies on DTPs have been performed in vitro and there are only limited data to support the notion that DTPs actually contribute to clinical therapy resistance. To test whether BET inhibition eliminates persisters in vivo, we performed animal experiments. In the first experiment, we engrafted PC9 lung cancer cells into immunocompromised mice. To obtain DTP populations in vivo, mice were treated with osimertinib continuously for 28 days. DTPs only represent a rare subpopulation of parental cancer cells, which is supported by the observation that after 28 days of treatment, tumor volumes drop to a range of 0.5–40 mm3 (Figure 6A). After 28 days of DTP induction, mice were randomly assigned to subsequent treatment with either vehicle alone or BET inhibitor. The switch to vehicle allowed the regrowth of tumors, presumably from DTPs. In contrast, subsequent treatment with BET inhibitor suppressed DTEPs and delayed tumor relapse in vivo without apparent toxicity for mice, as analyzed by body weight (Figure 6A). Importantly, treatment with a single-agent BET inhibitor resulted in statistically insignificant growth suppression of parental PC9 cells (Figure S13A). Similar results were obtained in the A375 melanoma model. DTPs induced by continuous treatment with dabrafenib and trametinib for 28 days were sensitive to subsequent treatment with BET inhibitor, because such treatment significantly inhibited DTEP outgrowth as judged by the delay in tumor relapse. Again, treatment with BET inhibitor did not significantly control the growth of parental A375 cells in vivo (Figures 6B and S13B).
Figure 6.

BET inhibitor suppressed DTEPs and delayed tumor relapse in vivo with a well-tolerated toxicity
(A) Relative tumor volumes and mice weights in sequential treatment groups with either vehicle or NEO2734 in PC9 subcutaneous-bearing mice. Mice were switched to vehicle or NEO2734 treatment at day 28 (n = 6 for each group) (osimertinib, 10 mg/kg once daily, and NEO2734, 4 mg/kg, 5 days/week).
(B) Relative tumor volumes and mice weights in sequential treatment groups with either vehicle or NEO2734 in A375 subcutaneous-bearing mice. Mice were switched to vehicle or NEO2734 treatment at day 28 (n = 6 for dabrafenib + trametinib to vehicle, n = 5 for dabrafenib + trametinib to NEO2734) (4 mg/kg NEO2734, 5 days/week; 30 mg/kg dabrafenib + 0.6 mg/kg trametinib daily).
(C) Relative tumor volumes and weights for PC9-bearing mice receiving osimertinib monotherapy or osimertinib + NEO2734 combination therapy. Treatments were stopped at day 28 (n = 6 for each group) (osimertinib, 10 mg/kg once daily, and NEO2734, 4 mg/kg, 5 days/week).
(D) Relative tumor volumes and weights for A375-bearing mice receiving combination treatment of dabrafenib (D) + trametinib (T) or triple treatment with NEO2734 (N). Mice were treated continuously (n = 6 for each group)) (4 mg/kg NEO2734, 5 days/week; 30 mg/kg dabrafenib + 0.6 mg/kg trametinib daily). Data are presented as mean ± SEM. Two-way ANOVA was applied for the in vivo study statistical analysis (∗p ≤ 0.05; ∗∗p ≤ 0.01; ∗∗∗p ≤ 0.001).
To gain more insight into the roles of persisters and BET inhibition in resistance to treatment, we tried to establish spontaneous relapse xenograft models using PC9 and A375 cells treated with osimertinib or dabrafenib plus trametinib, respectively. However, for the PC9 in vivo model, osimertinib did not give rise to any spontaneous relapses, even after 4 months (data not shown). Therefore, we mimicked the process of spontaneous relapse by drug removal after 28 days of therapy. Due to tumor heterogeneity, DTPs are not likely to be induced synchronously. Therefore, we also used standard-of-care therapy and BET inhibitor in combination from the beginning. Up-front treatment with combinational therapy of osimertinib and BET inhibitor for 28 days significantly prolonged the time to tumor relapse after drug removal compared to the osimertinib monotherapy group, with no apparent toxicity observed in the animals (Figure 6C). More strikingly, in the A375 melanoma model, tumors gradually began to relapse starting from 40 days. However, triple treatment with BET inhibitor completely prevented spontaneous relapse without weight loss (Figure 6D). In summary, the in vivo results show that BET inhibition suppresses persisters directly in a sequential treatment and delayed tumor spontaneous relapse without any significant effect on the proliferation of the parental cell population. We conclude that co-treatment with BET inhibitor prolongs time to tumor relapse through killing drug-tolerant persisters.
Discussion
It is generally believed that the DTP population serves as a reservoir from which genetically resistant clones can emerge.2,9 Although mounting evidence supports the existence of DTPs in various cancer types, most studies in this field are performed in vitro. Thus, there is a need for evidence supporting the role of DTPs in cancer recurrence in vivo. Here, we used an unbiased approach to identify the largest vulnerabilities of DTPs and provide proof-of-concept in animal studies that the use of BET inhibitors either in a sequential therapeutic strategy or in an up-front combinational treatment can delay cancer recurrence in cancers of different tissues of origin. The drug synergy we observed here does not result from synergistic effects on the same cell populations, because BET inhibitors did not affect the growth of parental cells. That drug synergy can result from targeting different subpopulations of cancer cells was already suggested by others.13
DTPs are known to be vulnerable to ferroptosis induction.17 Ferroptosis has been actively explored in the field as a promising strategy for anti-cancer treatment not only restricted to the eradication of DTPs. However, the preclinical drugs inducing ferroptosis by directly targeting GPX4 such as RSL3 and ML210 cannot be used in vivo due to toxicity, which may be explained by a recent finding that the increased sensitivity to ferroptosis induction has been observed in human hematopoietic stem cells (HSCs).27 This raised concerns about the potential side effects that similar reagents may cause to hematopoiesis and HSC function. Ferroptosis was also described in neutrophils dampening the anti-cancer immune response and clinical outcome of immunotherapies.28 Hence, more work is likely needed to exploit ferroptosis as a cancer treatment strategy.
In our study, we demonstrated that BET inhibitors eliminate persisters both in vitro and in vivo, delaying tumor recurrence with well-tolerated toxicity. Mechanistically, BET inhibition increases intracellular ROS to lethal levels by inhibiting DTP marker genes with anti-oxidative function, including GPX2, ALDH3A1, and MGST1. It has been shown before that DTPs are under high oxidative stress, making them more vulnerable to anti-oxidative regulation. The sources of the increased ROS in DTPs are still elusive, but they may be related to their altered metabolism. Using bulk RNA-seq and scRNA-seq, we uncovered that BET inhibitors specifically suppressed the anti-oxidative DTP markers, which caused a further accumulation of ROS. Oren et al.4 reported the existence of both non-cycling and slowly cycling DTPs. GPX2 is preferentially expressed in slowly cycling DTPs, essentially for their maintenance, whereas RSL3-mediated ferroptosis induction could only selectively eliminate non-cycling persister cells. It has been demonstrated that MGST1 inhibits ferroptotic cancer cell death in pancreatic ductal adenocarcinoma.25 By suppressing GPX2 and MGST1 simultaneously, BET inhibitors have the potential to eliminate both cycling and non-cycling persisters.
Cellular stress can lead to different cellular states such as senescence, dormancy, DTP state, and diapause.2,7,19,29 However, to date, there is a lack of gold standard biomarkers to distinguish these states. In this study, we show that DTPs share similarities with senescent cells but have different vulnerabilities. Previously, our group uncovered the bystander effect of senescent cells to sensitize surrounding nonsenescent cells to senolytic treatment. Moreover, the senescence-associated secretory phenotype has been reported to promote cancer response to immune checkpoint inhibitors. In this study, we also found increased expression of secreted proteins in DTPs as compared to parental treatment-naive cells (Figure S7C). Based on transcriptomic data, we observed that DTPs preferentially enhanced the expression of intercellular cell adhesion molecule, chemokine (C-C motif) ligand 5, and inflammatory cytokine IL-6, which are essential for lymphocyte recruitment and immune cell activation (Figure S9G). Combinational treatments with standard-of-care therapy and immune checkpoint inhibitor have showed an unexpected success clinically.30 Future investigations into the potential effects of DTPs on shaping the tumor microenvironment may provide additional insights into how to best target DTPs to delay tumor relapse.
Limitations of the study
We performed a kinome-based genetic screen on DTPs to identify their vulnerabilities. The limited size of the library used was the consequence of the rareness of DTPs. As a consequence, we do not have a comprehensive overview of the vulnerabilities of DTPs from this experiment. A second limitation of the study is that there are no biomarkers to unambiguously identify DTPs in vivo. Hence, our conclusion that BRD inhibitor treatment delays relapse by eliminating DTPs cannot be verified directly in vivo and is based on our in vitro observations.
STAR★Methods
Key resources table
| REAGENT or RESOURCE | SOURCE | IDENTIFIER |
|---|---|---|
| Antibodies | ||
| Rabbit polyclonal anti-BRD2 antibody | Bethyl | Cat# A302-582A; RRID: AB_2034828 |
| Cas9 (7A9-3A3) antibody | Cell Signaling Technology | Cat# 14697, RRID: AB_2750916 |
| β-Actin (8H10D10) Mouse mAb antibody | Cell Signaling Technology | Cat# 3700, RRID: AB_2242334 |
| Goat Anti-Rabbit IgG (H L)-HRP Conjugate antibody | Bio-Rad | Cat# 170–6515, RRID: AB_11125142 |
| Goat Anti-Mouse IgG (H L)-HRP Conjugate antibody | Bio-Rad | Cat# 170–6516, RRID: AB_11125547 |
| Chemicals, peptides, and recombinant proteins | ||
| DMEM High Glucose, pyruvate | Gibco | Cat# 41966-029 |
| RPMI 1640 medium | Gibco | Cat# 21875-034 |
| Penicillin-Streptomycin | Gibco | Cat# 15140-122 |
| Trypsin-EDTA (0.05%), phenol red | Gibco | Cat# 25300-054 |
| L-Glutamine 200mM | Gibco | Cat# 25030-024 |
| Matrigel Basement Membrane Matirx | Corning | Cat# 354234 |
| Polybrene | Santa Cruz Biotechnology | Cat# sc-134220 |
| Polyethylenimine hydrochloride | Sigma-Aldrich | Cat# 764892 |
| Doxycycline hyclate | Sigma-Aldrich | Cat# D5207 |
| N-acetylcysteine amide | Sigma-Aldrich | Cat# A0737 |
| Gefitinib | Selleck | Cat# S1025 |
| Osimertinib | Selleck | Cat# S7297 |
| Alisertib | Selleck | Cat# S1133 |
| Crizotinib | Selleck | Cat# S1068 |
| Sotorasib (AMG510) | Selleck | Cat# S8830 |
| Ferrostatin-1 | Selleck | Cat# S7243 |
| Z-VAD-FMK | Selleck | Cat# S7023 |
| B/B Homodimerizer | Takara | Cat# 635069 |
| Trametinib | MedKoo | Cat# 201458 |
| Dabrafinib | MedChemExpress | Cat# HY-14660 |
| RSL3 | Selleck | S8155 |
| NEO2734 | Selleck | S9648 |
| ARV-771 | Selleck | S8532 |
| CC90010 | Selleck | S3573 |
| ABT263 | Selleck | S1001 |
| Critical commercial assays | ||
| ISOLATE II PCR and Gel Kit | Meridian Bioscience | Cat# BIO-52060 |
| Auick-DNA Miniprep Kit | ZYMO Research | Cat# D3024&D3025 |
| SensiFAST cDNA Synthesis Kit | Meridian Bioscience | Cat# BIO-65054 |
| SensiFAST SYBR Lo-ROX Kit | Meridian Bioscience | Cat# BIO-94020 |
| Deposited data | ||
| scRNA seq data | Zenodo | https://doi.org/10.5281/zenodo.10575819 |
| Bulk RNA-seq data | Zenodo | https://doi.org/10.5281/zenodo.10575970 |
| Experimental models: Cell lines | ||
| PC-9; human EGFR-mutant NSCLC, male | ATCC | STR profiled |
| H358; human G12C-mutant NSCLC, male | ATCC | CRL-5807 |
| GTL-16: human MET amplified gastric adenocarcinoma | VictoriaWANG Lab | N/A |
| A375: human BRAF mutant melanoma, femal | ATCC | CRL-1619 |
| HEK293 | ATCC | CRL-1573 |
| Experimental models: Organisms/Strains | ||
| Mouse: Ncr nude mice | Janvier Laboratories | N/A |
| Oligonucleotides | ||
| qPCR primers, see Table S3 | IDT | N/A |
| shRNA targeting sequence, see Table S3 | TRC library | N/A |
| Recombinant DNA | ||
| MISSION® TRC-Hs 1.0 (Human) | Sigma-Aldrich | N/A |
| lentiGuide -Puro | Addgene | Cat# 52963 |
| Human Brunello kinome pooled library, guides 1–4 in lentiGuide-Puro backbone | Addgene | Cat# 75312 |
| hORFeome V8.1 Library | Broad | N/A |
| Software and algorithms | ||
| Graphpad Prism | https://www.graphpad.com/features | |
| Single Cell 3′ v3 with cellranger-7.0.1 | https://support.10xgenomics.com/ | |
| R version 4.2.3 | https://www.R-project.org/ | |
| Seurat v 4.3.0 | http://satijalab.org/seurat/ | |
| Other | ||
| Key codes for scRNA analyses | Zenodo | https://doi.org/10.5281/zenodo.10679694 |
Resource availability
Lead contact
Further information and requests for resources and reagents should be directed to René Bernards (r.bernards@nki.nl).
Materials availability
All unique/stable reagents generated in this study are available from the lead contact with a completed Materials Transfer Agreement.
Data and code availability
Sequencing data generated in this study has been deposited at Zenodo through https://doi.org/10.5281/zenodo.10575819 and https://doi.org/10.5281/zenodo.10575970 for scRNA-seq and bulk RNA-seq accordingly. Key codes are available at https://github.com/YangJAT/DTP and https://doi.org/10.5281/zenodo.10679694. This paper does not report original code. Any additional information required to reanalyze the data reported in this paper is available from the lead contact upon reasonable request.
Experimental model and study participant details
Animal models
Male/Female Balb/c nude (cAnN/Rj), 6-week old, were purchased from Janvier Laboratories, The Netherlands. PC9 cells (5 million per mice) were injected into the right flanks of nude female mice. Tumor volume was determined by a digital caliper and quantified by the modified ellipsoidal formula (tumor volume = 1/2(length × width2)). Tumor volume and mice weight were monitored three times a week. Osimertinib (10 mg/kg once daily) and NEO2734 (4 mg/kg, 5 days/week) were administered orally as a suspension using 0.5% hydroxypropyl methylcellulose (HPMC) or 10% DMSO+20%Cremophor EL+70% Saline as vehicle, respectively. Control vehicle mice received 0.5% HPMC and 10% DMSO+20%Cremophor EL+70% Saline administered orally. When the tumors reached approximately 200mm3 of volume, mice were randomly assigned into various treatment groups with 6 mice per group. For the sequential study, mice were randomized to receive either vehicle, 4 mg/kg NEO2734, 10 mg/kg Osimertinib for 28 days switched to either Vehicle-NEO2734 or 4 mg/kg NEO2734. For the upfronted combinational treatment, mice were randomized to receive either Osimertinib or Osimertinib and NEO2734 for 28 days. After that, the treatment will be suspended. For A375 xenograft study, 5 million cells were injected into the right flanks of nude mice. Dabrafenib (Dabra) and Trametinib (Trame) were dissolved in 10% DMSO+20%Cremophor EL+70% Saline and injected by oral gavage. When the tumors reached approximately 200mm3 of volume, mice were randomized to receive either vehicle, 4 mg/kg NEO2734, 30 mg/kg Dabra+0.6 mg/kg Trame for 28 days switched to either Vehicle-NEO2734 or 4 mg/kg NEO2734, combinational treatment of Dabra+Trame, triple treatment of Dabra+Trame+NEO2734. The mice were maintained and monitored for tumors relapse and humanely euthanized at endpoint.
All in vivo studies were conducted at the Netherlands Cancer Institute with the approval of the Institutional guidelines.
Cell line authentication
Cell lines PC9, H358 and GTL-16 were grown in RPMI-1640 (Gibco), supplemented with 10%FBS, and 1% penicillin/streptomycin (Gibco) and 1% glutamine (Gibco). A375 and HEK293 cells were grown in DMEM supplemented with 10%FBS, and 1% penicillin/streptomycin (Gibco) and 1% glutamine (Gibco). Cell lines PC9, A375 (CRL-1619), H358 (CRL-5807) and HEK293 (CRL-1573) were purchased from ATCC. GTL-16 was a gift from Victoria Wang. All cell lines have been validated by STR profiling and were regularly tested for mycoplasma spp with a PCR-based assay.
Method details
Reagents
DMEM High Glucose (Gibco), RPMI 1640 (Gibco), Trypsin 0.05% (Gibco), penicillin/streptomycin 1X (Gibco), Glutamine (Gibco), Matrigel (Corning), Polybrene (Santa Cruz Biotechnology), Polyethylenimine (Sigma-Aldrich), BRD2 antibody (Bethyl Laboratories), β-actin (Cell Signaling Technology), Osimertinib (MedchemExpress, Selleck), CID compound (Takara 635088), Doxycycline (Sigma), Alisertib (Selleck), Trametinib (Medko), Dabrafenib (MedchemExpress), Crizotinib (Selleck), AMG510 (Selleck), RSL3(Selleck), NEO2734(Selleck), ARV-771(Selleck), CC90010 (Selleck), ABT-263 (Selleck), Ferrostatin (Selleck), Z-VAD-FMK (Selleck), N-acetylcysteine amide (Sigma).
Drug treatments
Conditions for DTP induction are listed as follows: For PC9, cells were treated with either 200nM Osimertinib or 500nM Gefitinib for 1 week followed by Osi/Gefi plus 10nM CID for 1 week; A375 cells were treated with 2μM Dabrafenib plus 2 μM Trametinib. GTL-16 cells were treated with 2μM Crizotinib; H358 were treated with 2μM AMG510. Treatment time were 2 weeks for DTP induction. Cells were treated with 1 μg/ml doxycycline for Cas9 induction. For the rescue experiments, DTPs were treated with BET inhibitors together with either ferrostatin at 2.5μM, NAC at 2.5 mM and Z-VAD-FMK at 10μm. Concentrations of BET inhibitors and RSL3 were 0.25μM for NEO2734, 0.25 μM for ARV-771, 0.25μM for CC90010, 1 μM for RSL3 and 125 ng/ml for Conatumumab.
Compound screen
Workflow for compound screen was summarized in Figure 1A. Cells were screened for sensitivity against a panel of 163 small-molecule inhibitors from a stress-focused compound library (Matheus, Dias et al., 2023). In brief, PC9 cells were treated with 2.5 μM Alisertib for 7 days for senescence induction, gefitinib plus CID for 2 weeks for DTP induction. Then parental proliferating cells, senescent cells, DTPs and DTEPs were seeded in 384-well plates. All compounds were tested at fifteen concentrations. Each plate included 8 wells containing DMSO (as a negative control) and 8 wells containing 10 μM PAO (as a positive control). The cell viability in each well was determined using CellTiter-Blue reagent (Promega). AUC scores were calculated for each compound. The relative sensitivities of parental PC9-SS, senescent cells, DTPs and DTEPs were normalized against parental conditions after subtraction of background signal.
CRISPR/Cas9-based genetic screen
Workflow for CRISPR based genetic screen was summarized in Figure 1C. To ensure cells to be homogenously induced into DTPs while maintain high genome editing capacity, monoclonal cells with high CAS9 induction by doxycycline were selected. Gene editing efficiency was tested after DTP induction. The cells were infected with lentiviral vector pXPR-011 containing EGFP with gRNA against EGFR first and then were induced into DTPs. Gene editing efficiency was determined by the percentage of EGFP positive cells after 10 days of doxycycline treatment (Figures S2A–S2C). For the genetic screen in Figure 1C, monoclonal PC9-iCas9 cells were infected with kinome-wide gRNA virus with 500 coverage and multiplicity of infection of 0.3. After puromycin selection, these cells were seeded for DTP induction as described above. Afterward, DTPs were reseeded and switched to doxycycline treatment for 10days. Changes in gRNAs representation after 10days of dox induction were determined by Illumina deep sequencing. Parental proliferating cells were included as the control arm to filter out essential genes and to determine the sgRNAs specifically dropped out in DTP arm.
RNA-sequencing and GSEA analysis
Cells were seeded in 150-mm cell culture dishes and were treated with different stand of care therapy (See Drug treatment-DTP induction). Paired samples of PAR/DTP were collected for RNA seq at T0. DTPs were seeded into 6 well plate one day before NEO2374 treatment. Samples were collected 48h and 72h after treatment. RNA isolation, library preparation and RNA sequencing were performed as described before.31 RNA-seq data for the samples was normalized based on a relative total size factor. Data was then filtered for protein coding genes and in case of more than one transcript for a gene, the mean was taken. For dtp versus parental, both at timepoint 0, the log2 fold change was calculated. For DTEP-UN versus DTEP-TR, both at time point 1 and time point 2, the log2 fold change wea calculated. A list was created with the genes sorted on this log2 fold change value in decreasing order. GSEA was performed based on this list for both the MsigDb Hallmark genesets and the KEGG genesets using the bioconductor package fgsea (Gennady Korotkevich et al. 2021). The clustering heatmaps were created using the heatmap.2 function of the R-package gplots. The difference of persisters derived from different tissue origins was reflected by difference among NES score (indicates c in the formula) calculated through GSEA analysis for paired DTP T0 vs. Par T0. Formula used for calculation is listed below:
where is the total number of characteristics, and are respectively the -th characteristics of the sample 1 and 2.
Single cell RNA sequencing
For each single cell suspension (Parental PC9, DTPs, DTEPs-UN-T1, DTEPs-TR-T1, DTEP-UN-T2, DTEP-TR-T2), approximately 5000 cells were loaded per sample. Sample preparations and library constructions were performed according to 10x Genomics manufacturer’s instructions. The data processing (normalization, dimensional reduction, clustering and visualization) was done in R version 4.2.3(https://www.R-project.org/.) using Seurat v 4.3.0.32 Gene marker identification was also performed using Seurat v 4.3.0 using the Wilcox rank-sum test. The differential expression were performed on scaled data. Uniform Manifold Approximation and Projection (UMAP) reduction and the FindNeighbors were performed using first 30 PCA components as recommended in the Seurat SCT processing vignette. Signature scores for each cell were calculated using the AddModuleScore function, and the senescence-related gene lists were achieved from previous publications.33,34 DTEP-UN-T1 and DTEP-UN-T2, DTEP-TR-T1 and DTEP-TR-T2 were analyzed as duplicates.
Plasmids
shRNA vectors were collected from the TRC library (Table S3). cFlip overexpression lentiviral vectors were collected from the BROAD ORF cDNA library. gRNA cloning vector pLentiGuide-puro (52963) and human CRIPSR Knockout Pooled Library (Kinome) (75312) were purchased from Addgene. The edit-R inducible Lentiviral Cas9 vector (NC1606271) was purchase from Dharmacon.
Cell viability measurement
Cell viability was detected by CellTiter-Blue Cell Viability Assay kit (G8081, Promega) according to the manufacturers’ instructions. DTPs were induced by different stand of care therapy for 14 days. Next, parental and DTP cells were trypsinized, washed out the primary treatment and seeded at an equal cell density in the plates. Afterward, cells were treated with other drugs. CellTiter-Blue reagent was added at day 5 and measurement was performed by EnVision multi-label plate reader (PerkinElmer). For the rescue experiments, cells were treated with BET inhibitors/RSL3 together with NAC/Ferrostatin/Z-VAD-FMK with the dose indicated in figure legend for 5 days followed by replenished with fresh medium for another 7 days. Afterward, cellTiter-Blue reagent was added and measurement was performed. Dose-response curves were calculated by PRISM. Triplicate were performed for each group.
Long term colony formation assays
Parental proliferating cells and DTPs were seeded into 96 well plates at 2,000 cells/well. The next day, cells were treated with drugs. Parental proliferating cells were collected at day 5. DTEPs were collected at day 10 to let the control groups reach over 90% of confluence. At the end of the assay, cells were fixed with 3.7% formaldehyde (1.04002, Millipore) diluted in PBS, stained with 2% crystal violet overnight (HT90132 Sigma-Aldrich). Images were scanned with Fiji. Triplicate were performed for each group.
Incucyte cell proliferation assays and caspase-3/7 activity monitoring
Cells were seeded in 96 well plates (2,000 cells per well in 100μL of growth medium). The next day, drugs were added onto cells as indicated. Apoptosis marker staining was performed by adding CellEvent caspase-3/7 green apoptosis assay reagent (Molecular Probes) at 1,000 times dilution to each well. The cells were subsequently scanned every 6 h using the Incucyte ZOOM live cell analysis system (Essen Bioscience) typically for a total of 72 h. Cell confluence and GFP signal were measured and quantified by the incucyte imaging system. Triplicate were performed for each group.
Lentiviral transductions
Lentiviral particles were created using lentivirus packaging system containing pCMV-VSV-G (Addgene 8454), pRSV-Rev (Addgene 12253), and pMDLg/pRRE (Addgene 12251). Lentiviral supernatants were collected after transfection performed in HEK293 cells. Lentivirus transduced cells were selected with 2 μg/ml puromycin or 10 μg/ml blasticidin.
CRISPR mediated knockout of BRD2
BRD2 knockout cells were generated by using the gRNA (5′- CCTGAGATACCTACCACTGT-3′). gRNA was cloned into LentiGuide-ouro (Addgene plasmid 52963) via BsmBI sites with Gibson Assembly Master Mix (E2611, NEB). Afterward, gRNA-BRD2 were transduced into PC9-iCas9 cells by lentiviral infection. After puromycin selection, doxycycline was added to activate genome editing. After 72h, BRD2KO clones were picked.
Western Blotting and antibodies
Cells were seeded in the culture medium and lysed in RIPA buffer supplemented with protease inhibitors (Roche) and phosphatase inhibitors cocktails II and III (Sigma). Twenty micrograms of total protein were used for immunoblotting according to the antibody manufacture’s recommendations. Samples were processed with Novex NuPAGE Gel Electrophoresis Systems (Invitrogen).
RNA extraction and quantitative PCR (QPCR)
Total RNA was extracted using Quick-RNA MiniProp (R1055, Zymo Research). The RNA concentrations were measured with Nanodrop (Thermo Fisher Scientific) and 1μg of total RNA was used for cDNA cDNA synthesis using Maxima Universal FirstStrand cDNA synthesis kit (Thermo Fisher Scientific). The QPCR reactions were set up using FastStart Universal SYBP Green master (Rox) from Roche. The experiments were performed according to the manufacturers’ instructions. All reactions were run in triplicate. Primer information can be found in Table S3.
Senescence-associated β-galactosidase staining
PC9 parental and DTP cells were plated into 6-well plates at 100,000 cells/well in triplicate. β-galactosidase activity was stained one day after with β-galactosidase Staining kit (Sigma) according to manufacturer’s protocol. After staining, cells were imaged (3 images/well), and stained cells were manually counted from the images.
Reactive oxygen species staining and flow cytometry
Parental and DTPs were seeded into 6 well plates at 100,000 cells/well. DTPs were maintained in either fresh medium to obtain DTEPs or in drug containing medium to maintain DTP status. The next day, DTEPs were treated with NEO2734 or DMSO at dose of 0.5 μM for 72h. Intracellular ROS levels were determined by CellROX Green Flow Cytometry Assay Kit (Life Technologies) according to kit protocol. After staining, cells were measured by flow cytometry on a BD LSRFortessa and analyzed by Flowjo v.10.
Quantification and statistical analysis
Statistical analyses
Two-tailed unpaired t-test with Welch’s correction were applied to compare statistical significance between two groups. All statistical analyses were generated using GraphPad Prism 9 software, except for bulk RNA seq and scRNA seq analysis where statistical analyses were run in R. Data are presented as mean standard deviation or standard error, as indicated in the figure legends. A P-value less than 0.05 was considered statistically significant in all analyses (P < 0.05: ∗; P < 0.01: ∗∗; P < 0.001: ∗∗∗). Any cutoffs used for P-value or FDR are indicated in the figure legends. All analyses were performed with 3–6 replicates as indicated in the method details. In animal experiments n represents the number of animals in treatment groups.
Acknowledgments
We thank Victoria Wang for the kind gift of GTL-16 cells. We thank Frank van Gemert and Martijn van Baalen from the NKI Flow Cytometry Facility for their technical support. We thank Ming Wu from Bayer AG for her suggestion on scRNA analysis. This work was supported by grant no. 101007937 of the Innovative Medicines Initiative.
Author contributions
Conceptualization, M.C., L.W., R.L.B., and R.B. Investigation, M.C., S.M., C.L., A.V., I.d.R., C.Y., H.J.K., B.M., F.E., F.J., O.v.T., M.B., N.P., R.A.J., S.Q., H.J., J.C.K.v.d.M., and S.V. Resources, A.S., L.W., W.Q., R.L.B., and R.B. Methodology, M.C., L.W., R.L.B., and R.B. Formal analyses, M.C., C.L., A.V., I.d.R., and C.Y. Writing, M.C., R.L.B., and R.B. Funding acquisition, R.B. Supervision, L.W., R.L.B., and R.B.
Declaration of interests
The authors declare no competing interests.
Published: March 19, 2024
Footnotes
Supplemental information can be found online at https://doi.org/10.1016/j.xcrm.2024.101471.
Contributor Information
Liqin Wang, Email: l.wang@nki.nl.
René Bernards, Email: r.bernards@nki.nl.
Supplemental information
References
- 1.Dhanyamraju P.K., Schell T.D., Amin S., Robertson G.P. Drug-Tolerant Persister Cells in Cancer Therapy Resistance. Cancer Res. 2022;82:2503–2514. doi: 10.1158/0008-5472.CAN-21-3844. [DOI] [PMC free article] [PubMed] [Google Scholar]
- 2.De Conti G., Dias M.H., Bernards R. Fighting Drug Resistance through the Targeting of Drug-Tolerant Persister Cells. Cancers. 2021;13 doi: 10.3390/cancers13051118. [DOI] [PMC free article] [PubMed] [Google Scholar]
- 3.Sharma S.V., Lee D.Y., Li B., Quinlan M.P., Takahashi F., Maheswaran S., McDermott U., Azizian N., Zou L., Fischbach M.A., et al. A chromatin-mediated reversible drug-tolerant state in cancer cell subpopulations. Cell. 2010;141:69–80. doi: 10.1016/j.cell.2010.02.027. [DOI] [PMC free article] [PubMed] [Google Scholar]
- 4.Oren Y., Tsabar M., Cuoco M.S., Amir-Zilberstein L., Cabanos H.F., Hütter J.C., Hu B., Thakore P.I., Tabaka M., Fulco C.P., et al. Cycling cancer persister cells arise from lineages with distinct programs. Nature. 2021;596:576–582. doi: 10.1038/s41586-021-03796-6. [DOI] [PMC free article] [PubMed] [Google Scholar]
- 5.Marsolier J., Prompsy P., Durand A., Lyne A.M., Landragin C., Trouchet A., Bento S.T., Eisele A., Foulon S., Baudre L., et al. H3K27me3 conditions chemotolerance in triple-negative breast cancer. Nat. Genet. 2022;54:459–468. doi: 10.1038/s41588-022-01047-6. [DOI] [PMC free article] [PubMed] [Google Scholar]
- 6.Shen S., Vagner S., Robert C. Persistent Cancer Cells: The Deadly Survivors. Cell. 2020;183:860–874. doi: 10.1016/j.cell.2020.10.027. [DOI] [PubMed] [Google Scholar]
- 7.Kurppa K.J., Liu Y., To C., Zhang T., Fan M., Vajdi A., Knelson E.H., Xie Y., Lim K., Cejas P., et al. Treatment-Induced Tumor Dormancy through YAP-Mediated Transcriptional Reprogramming of the Apoptotic Pathway. Cancer Cell. 2020;37:104–122.e12. doi: 10.1016/j.ccell.2019.12.006. [DOI] [PMC free article] [PubMed] [Google Scholar]
- 8.Blakely C.M., Pazarentzos E., Olivas V., Asthana S., Yan J.J., Tan I., Hrustanovic G., Chan E., Lin L., Neel D.S., et al. NF-kappaB-activating complex engaged in response to EGFR oncogene inhibition drives tumor cell survival and residual disease in lung cancer. Cell Rep. 2015;11:98–110. doi: 10.1016/j.celrep.2015.03.012. [DOI] [PMC free article] [PubMed] [Google Scholar]
- 9.Tyner J.W., Haderk F., Kumaraswamy A., Baughn L.B., Van Ness B., Liu S., Marathe H., Alumkal J.J., Bivona T.G., Chan K.S., et al. Understanding Drug Sensitivity and Tackling Resistance in Cancer. Cancer Res. 2022;82:1448–1460. doi: 10.1158/0008-5472.CAN-21-3695. [DOI] [PMC free article] [PubMed] [Google Scholar]
- 10.Wilson C., Nicholes K., Bustos D., Lin E., Song Q., Stephan J.P., Kirkpatrick D.S., Settleman J. Overcoming EMT-associated resistance to anti-cancer drugs via Src/FAK pathway inhibition. Oncotarget. 2014;5:7328–7341. doi: 10.18632/oncotarget.2397. [DOI] [PMC free article] [PubMed] [Google Scholar]
- 11.Shen S., Faouzi S., Souquere S., Roy S., Routier E., Libenciuc C., André F., Pierron G., Scoazec J.Y., Robert C. Melanoma Persister Cells Are Tolerant to BRAF/MEK Inhibitors via ACOX1-Mediated Fatty Acid Oxidation. Cell Rep. 2020;33 doi: 10.1016/j.celrep.2020.108421. [DOI] [PubMed] [Google Scholar]
- 12.Hata A.N., Niederst M.J., Archibald H.L., Gomez-Caraballo M., Siddiqui F.M., Mulvey H.E., Maruvka Y.E., Ji F., Bhang H.e.C., Krishnamurthy Radhakrishna V., et al. Tumor cells can follow distinct evolutionary paths to become resistant to epidermal growth factor receptor inhibition. Nat. Med. 2016;22:262–269. doi: 10.1038/nm.4040. [DOI] [PMC free article] [PubMed] [Google Scholar]
- 13.Palmer A.C., Sorger P.K. Combination Cancer Therapy Can Confer Benefit via Patient-to-Patient Variability without Drug Additivity or Synergy. Cell. 2017;171:1678–1691.e13. doi: 10.1016/j.cell.2017.11.009. [DOI] [PMC free article] [PubMed] [Google Scholar]
- 14.Criscione S.W., Martin M.J., Oien D.B., Gorthi A., Miragaia R.J., Zhang J., Chen H., Karl D.L., Mendler K., Markovets A., et al. The landscape of therapeutic vulnerabilities in EGFR inhibitor osimertinib drug tolerant persister cells. NPJ Precis. Oncol. 2022;6:95. doi: 10.1038/s41698-022-00337-w. [DOI] [PMC free article] [PubMed] [Google Scholar]
- 15.Schepers A., Jochems F., Lieftink C., Wang L., Pogacar Z., Leite de Oliveira R., De Conti G., Beijersbergen R.L., Bernards R. Identification of Autophagy-Related Genes as Targets for Senescence Induction Using a Customizable CRISPR-Based Suicide Switch Screen. Mol. Cancer Res. 2021;19:1613–1621. doi: 10.1158/1541-7786.MCR-21-0146. [DOI] [PMC free article] [PubMed] [Google Scholar]
- 16.Dias M.H., Friskes A., Wang S., Neto J.M.F., Gemert F.v., Mourragui S., Kuiken H.J., Mainardi S., Alvarez-Villanueva D., Lieftink C., et al. Paradoxical activation of oncogenic signaling as a cancer treatment strategy. bioRxiv. 2023 doi: 10.1101/2023.02.06.527335. Prepaint at. [DOI] [PMC free article] [PubMed] [Google Scholar]
- 17.Hangauer M.J., Viswanathan V.S., Ryan M.J., Bole D., Eaton J.K., Matov A., Galeas J., Dhruv H.D., Berens M.E., Schreiber S.L., et al. Drug-tolerant persister cancer cells are vulnerable to GPX4 inhibition. Nature. 2017;551:247–250. doi: 10.1038/nature24297. [DOI] [PMC free article] [PubMed] [Google Scholar]
- 18.Wang L., Jin H., Jochems F., Wang S., Lieftink C., Martinez I.M., De Conti G., Edwards F., de Oliveira R.L., Schepers A., et al. cFLIP suppression and DR5 activation sensitize senescent cancer cells to senolysis. Nat. Cancer. 2022;3:1284–1299. doi: 10.1038/s43018-022-00462-2. [DOI] [PubMed] [Google Scholar]
- 19.Dhimolea E., de Matos Simoes R., Kansara D., Al'Khafaji A., Bouyssou J., Weng X., Sharma S., Raja J., Awate P., Shirasaki R., et al. An Embryonic Diapause-like Adaptation with Suppressed Myc Activity Enables Tumor Treatment Persistence. Cancer Cell. 2021;39:240–256.e11. doi: 10.1016/j.ccell.2020.12.002. [DOI] [PMC free article] [PubMed] [Google Scholar]
- 20.Delmore J.E., Issa G.C., Lemieux M.E., Rahl P.B., Shi J., Jacobs H.M., Kastritis E., Gilpatrick T., Paranal R.M., Qi J., et al. BET bromodomain inhibition as a therapeutic strategy to target c-Myc. Cell. 2011;146:904–917. doi: 10.1016/j.cell.2011.08.017. [DOI] [PMC free article] [PubMed] [Google Scholar]
- 21.Lovén J., Hoke H.A., Lin C.Y., Lau A., Orlando D.A., Vakoc C.R., Bradner J.E., Lee T.I., Young R.A. Selective inhibition of tumor oncogenes by disruption of super-enhancers. Cell. 2013;153:320–334. doi: 10.1016/j.cell.2013.03.036. [DOI] [PMC free article] [PubMed] [Google Scholar]
- 22.Shen S., Faouzi S., Bastide A., Martineau S., Malka-Mahieu H., Fu Y., Sun X., Mateus C., Routier E., Roy S., et al. An epitranscriptomic mechanism underlies selective mRNA translation remodelling in melanoma persister cells. Nat. Commun. 2019;10:5713. doi: 10.1038/s41467-019-13360-6. [DOI] [PMC free article] [PubMed] [Google Scholar]
- 23.Karki P., Angardi V., Mier J.C., Orman M.A. A Transient Metabolic State in Melanoma Persister Cells Mediated by Chemotherapeutic Treatments. Front. Mol. Biosci. 2021;8 doi: 10.3389/fmolb.2021.780192. [DOI] [PMC free article] [PubMed] [Google Scholar]
- 24.Zhang Z., Tan Y., Huang C., Wei X. Redox signaling in drug-tolerant persister cells as an emerging therapeutic target. EBioMedicine. 2023;89 doi: 10.1016/j.ebiom.2023.104483. [DOI] [PMC free article] [PubMed] [Google Scholar]
- 25.Kuang F., Liu J., Xie Y., Tang D., Kang R. MGST1 is a redox-sensitive repressor of ferroptosis in pancreatic cancer cells. Cell Chem. Biol. 2021;28:765–775.e5. doi: 10.1016/j.chembiol.2021.01.006. [DOI] [PubMed] [Google Scholar]
- 26.Raha D., Wilson T.R., Peng J., Peterson D., Yue P., Evangelista M., Wilson C., Merchant M., Settleman J. The cancer stem cell marker aldehyde dehydrogenase is required to maintain a drug-tolerant tumor cell subpopulation. Cancer Res. 2014;74:3579–3590. doi: 10.1158/0008-5472.CAN-13-3456. [DOI] [PubMed] [Google Scholar]
- 27.Zhao J., Jia Y., Mahmut D., Deik A.A., Jeanfavre S., Clish C.B., Sankaran V.G. Human hematopoietic stem cell vulnerability to ferroptosis. Cell. 2023;186:732–747.e16. doi: 10.1016/j.cell.2023.01.020. [DOI] [PMC free article] [PubMed] [Google Scholar]
- 28.Kim R., Hashimoto A., Markosyan N., Tyurin V.A., Tyurina Y.Y., Kar G., Fu S., Sehgal M., Garcia-Gerique L., Kossenkov A., et al. Ferroptosis of tumour neutrophils causes immune suppression in cancer. Nature. 2022;612:338–346. doi: 10.1038/s41586-022-05443-0. [DOI] [PMC free article] [PubMed] [Google Scholar]
- 29.Wang L., Lankhorst L., Bernards R. Exploiting senescence for the treatment of cancer. Nat. Rev. Cancer. 2022;22:340–355. doi: 10.1038/s41568-022-00450-9. [DOI] [PubMed] [Google Scholar]
- 30.Patel S.A., Minn A.J. Combination Cancer Therapy with Immune Checkpoint Blockade: Mechanisms and Strategies. Immunity. 2018;48:417–433. doi: 10.1016/j.immuni.2018.03.007. [DOI] [PMC free article] [PubMed] [Google Scholar]
- 31.Jochems F., Thijssen B., De Conti G., Jansen R., Pogacar Z., Groot K., Wang L., Schepers A., Wang C., Jin H., et al. The Cancer SENESCopedia: A delineation of cancer cell senescence. Cell Rep. 2021;36 doi: 10.1016/j.celrep.2021.109441. [DOI] [PMC free article] [PubMed] [Google Scholar]
- 32.Hao Y., Hao S., Andersen-Nissen E., Mauck W.M., 3rd, Zheng S., Butler A., Lee M.J., Wilk A.J., Darby C., Zager M., et al. Integrated analysis of multimodal single-cell data. Cell. 2021;184:3573–3587.e29. doi: 10.1016/j.cell.2021.04.048. [DOI] [PMC free article] [PubMed] [Google Scholar]
- 33.Kinker G.S., Greenwald A.C., Tal R., Orlova Z., Cuoco M.S., McFarland J.M., Warren A., Rodman C., Roth J.A., Bender S.A., et al. Pan-cancer single-cell RNA-seq identifies recurring programs of cellular heterogeneity. Nat. Genet. 2020;52:1208–1218. doi: 10.1038/s41588-020-00726-6. [DOI] [PMC free article] [PubMed] [Google Scholar]
- 34.Barkley D., Moncada R., Pour M., Liberman D.A., Dryg I., Werba G., Wang W., Baron M., Rao A., Xia B., et al. Cancer cell states recur across tumor types and form specific interactions with the tumor microenvironment. Nat. Genet. 2022;54:1192–1201. doi: 10.1038/s41588-022-01141-9. [DOI] [PMC free article] [PubMed] [Google Scholar]
Associated Data
This section collects any data citations, data availability statements, or supplementary materials included in this article.
Supplementary Materials
Data Availability Statement
Sequencing data generated in this study has been deposited at Zenodo through https://doi.org/10.5281/zenodo.10575819 and https://doi.org/10.5281/zenodo.10575970 for scRNA-seq and bulk RNA-seq accordingly. Key codes are available at https://github.com/YangJAT/DTP and https://doi.org/10.5281/zenodo.10679694. This paper does not report original code. Any additional information required to reanalyze the data reported in this paper is available from the lead contact upon reasonable request.