An official website of the United States government
Here's how you know
Official websites use .gov
A
.gov website belongs to an official
government organization in the United States.
Secure .gov websites use HTTPS
A lock (
) or https:// means you've safely
connected to the .gov website. Share sensitive
information only on official, secure websites.
As a library, NLM provides access to scientific literature. Inclusion in an NLM database does not imply endorsement of, or agreement with,
the contents by NLM or the National Institutes of Health.
Learn more:
PMC Disclaimer
|
PMC Copyright Notice
. 2023 Nov 1;2023:214.
Long-Term Exposure to AIR Pollution and COVID-19 Mortality and
Morbidity in DENmark: Who Is Most Susceptible? (AIRCODEN)
Long-Term Exposure to AIR Pollution and COVID-19
Mortality and Morbidity in DENmark: Who Is Most Susceptible?
(AIRCODEN)
This Statement, prepared by the Health Effects Institute, summarizes a
research project funded by HEI and conducted by Dr. Zorana J. Andersen at
the University of Copenhagen, Denmark, and colleagues. Research Report 214
contains both the detailed Investigators’ Report and a Commentary on
the study prepared by the Institute’s Review Committee.
ANDERSEN 214
This study evaluated whether there is an association between exposure to
outdoor air pollution and the risk of COVID-19 incidence,
hospitalization, and mortality in a cohort of 3.7 million Danish
adults.
Andersen and colleagues found elevated risks of all three COVID-19
outcomes associated with exposures to fine and coarse particulate
matter, black carbon, and nitrogen dioxide.
Individuals aged 65 years and older who were exposed to nitrogen dioxide
and people with lower socioeconomic status who were exposed to nitrogen
dioxide or fine particulate matter were at greater risk of contracting
COVID-19 compared to younger or higher socioeconomic status individuals,
respectively.
Major strengths of the study were the inclusion of all Danish adults and
the rigorous adjustments for many individual- and contextual-level
characteristics.
This study showed that long-term exposures to outdoor air pollution
appear to be associated with adverse COVID-19 morbidity and mortality
among Danish adults.
BACKGROUND
Research from toxicology, human clinical studies, and epidemiology have linked air
pollution exposure with risk of respiratory infections, influenza, and respiratory
syncytial virus. Some early studies on air pollution and COVID-19 reported potential
associations, suggesting that the number of COVID-19 deaths might have been higher
in areas with higher levels of air pollution. The data and methodologies used in
these early studies were so fraught with errors, however, that the potential for
biased results was very high. In May 2020, only two months after the WHO declared
the COVID-19 outbreak a global pandemic, HEI issued RFA 20-1B, soliciting studies to
investigate potential links between air pollution, COVID-19, and human health, and
selected five studies in various countries. This Statement highlights a study by Dr.
Zorana Andersen and colleagues at the University of Copenhagen.
APPROACH
Andersen and colleagues aimed to investigate whether long-term exposure to air
pollution is associated with increased risk of COVID-19–related incidence,
hospitalization, and mortality in Danish adults. They focused on fine particulate
matter <2.5 μg/m3 in diameter, coarse particulate matter
<10 μg/m3 in diameter, black carbon, nitrogen dioxide, and
ozone. Second, they aimed to identify the most susceptible subgroups of the
population according to age, sex, socioeconomic status, ethnicity, and whether
pre-existing cardiovascular and respiratory disease, dementia, or diabetes increased
susceptibility. Third, they were interested in determining whether the prognosis of
COVID-19 hospitalization and mortality was poorer in a subgroup of people who had
tested positive for the disease.
Briefly, they used national registers to create a cohort of all adults residing in
Denmark on March 1, 2020, and at least 1 year prior to that. The cohort of 3.7
million people included detailed personal and community-level demographic and
socioeconomic information. They assigned annual estimates of pollution exposures for
the year 2019 based on data from chemical transport models to each
participant’s residential address. They used Cox proportional hazard models
to estimate associations between each pollutant and COVID-19 incidence,
hospitalization, mortality, and death from any cause until April 26, 2021, adjusting
for many individual and community-level characteristics.
The investigators conducted many additional analyses, including testing for effect
modification of any associations according to age, sex, socioeconomic status, and
comorbidities. They examined the shapes of exposure–response functions,
results from two-pollutant models, and whether associations between the pollutants
and these outcomes differed during two separate waves of the pandemic. The
investigators also examined associations between pollutants and COVID-19
hospitalization and death in a subgroup of individuals who had tested positive for
COVID-19.
KEY RESULTS
In the full cohort of 3.7 million Danish adults, about 139,000 individuals tested
positive for COVID-19, about 11,000 were hospitalized, and about 2,500 died from
COVID-19 during the 14 months of follow-up. Annual average exposures were estimated
at 7.4 μg/m3 for fine particulate matter, 12.7
μg/m3 for coarse particulate matter, 0.3
μg/m3 for black carbon, 10.7 μg/m3 for
nitrogen dioxide, and 54.5 μg/m3 ozone.
Andersen and colleagues found elevated risks of all three COVID-19 outcomes
associated with exposures to all the pollutants examined, with the exception of
ozone, which was inversely associated with these outcomes (see Statement Figure for results for
deaths from COVID-19). Overall, patterns for the three outcomes were fairly similar
to each other. Risks of increased COVID-19 incidence and hospitalizations were
strongest with exposure to nitrogen dioxide (i.e., hazard ratios and 95% confidence
intervals: 1.18 [1.14–1.23] and 1.19 [1.12–1.27] per 3.49
μg/m3, respectively), whereas risk of COVID-19 mortality was
strongest with exposure to fine particulate matter (i.e., 1.23 [1.04–1.44]
per 0.55 μg/m3). Risks for death from COVID-19 associated with
fine or coarse particulate matter or nitrogen dioxide were much higher than those
from all causes.
Associations between estimated annual average pollutant concentrations
and deaths from COVID-19. Hazard ratios and 95% confidence
intervals estimated per interquartile range increases in 1-year mean
exposure, namely: 0.55 μg/m3 for PM2.5, 1.14
μg/m3 for PM10, 0.09
μg/m3 for BC, 3.49 μg/m3 for
NO2, and 2.79 μg/m3 for O3.
(Source: Investigators’ Report Table 3).
Interestingly, the investigators found no associations between pollutant exposures
and COVID-19 outcomes during the first wave of the pandemic (March 1 to July 31,
2020), when the number of cases, hospitalizations, and deaths were much lower than
during the second wave (August 1, 2020 to April 26, 2021).
They found that older adults experienced greater risks associated with nitrogen
dioxide exposure (compared to younger people) and people with lower socioeconomic
status (according to several indicators) had greater risks associated with both
nitrogen dioxide and fine particulate matter exposures (compared to those of higher
socioeconomic status). The investigators also reported greater risks for COVID-19
incidence with nitrogen dioxide and fine particulate matter exposures among those
who had pre-existing cardiovascular and respiratory disease and among individuals
who had dementia and diabetes, although not all of these results were statistically
significant.
In analyses restricted to individuals who tested positive for COVID-19, the
investigators found that only exposures to nitrogen dioxide and fine particulate
matter were associated with increased risks of hospitalizations; but the risks were
notably smaller than those reported for the full cohort.
Last, results from analyses using two pollutants showed generally weaker
associations.
INTERPRETATION AND CONCLUSIONS
In its independent evaluation of the Investigators’ Report, the HEI Review
Committee concluded that this study represents an important contribution to our
knowledge about potential associations between long-term exposure to air pollution
and COVD-19–related health outcomes. Elevated risks for hospitalizations were
seen both in the general population and among those who tested positive for
COVID-19. The investigators also identified groups potentially most susceptible to
air pollution–related COVID-19 outcomes. Major strengths of the study design
were the inclusion of the entire adult Danish population and the rigorous
adjustments for individual- and contextual-level characteristics.
Some of the findings, however, remained difficult to interpret, including much higher
estimates of risk than those reported in many previous studies of air pollution. For
example, the reported risks for all-cause mortality are much greater than those
observed elsewhere. Other results that are difficult to explain included the weaker
associations among those who had tested positive for COVID-19 (as compared to among
the full cohort) and the inverse associations between exposure to ozone and several
outcomes.
The Committee agrees with the investigators that there are many challenges to
measuring cases of COVID-19 incidence, hospitalization, and death accurately. The
accuracy of the data depends on voluntary participation in testing, testing
capacity, accessibility, cost, and accuracy, which are likely to vary across Denmark
and throughout the pandemic.
Ultimately, the study design used here is a great improvement over others used in the
currently available literature on this topic. The results document that long-term
exposures to outdoor air pollution do appear to be associated with adverse COVID-19
morbidity and mortality among Danish adults.
Res Rep Health Eff Inst. 2023 Nov 1;2023:214.
Long-Term Exposure to AIR Pollution and COVID-19 Mortality and
Morbidity in DENmark: Who Is Most Susceptible? (AIRCODEN)
1 Section of Environmental Health, Department of Public
Health, University of Copenhagen,
Denmark
2 Section of Epidemiology, Department of Public Health,
University of Copenhagen,
Denmark
3
Statistics Denmark, Copenhagen,
Denmark
4
Institute for Risk Assessment Sciences, Utrecht
University, the Netherlands
5 Department of Environmental Science,
Aarhus University,
Denmark
6 Global Centre for Clean Air Research (GCARE),
University of Surrey, United
Kingdom
7
Climate, Interdisciplinary Centre for Climate Change, Aarhus
University, Roskilde, Denmark
8 Department of Public Health, University
of Copenhagen, Denmark
9 Department of Clinical Research,
Nordsjaellands Hospital, Hilleroed,
Denmark
This Investigators’ Report is one part of Health Effects Institute
Research Report 214, which also includes a Commentary by the Review
Committee and an HEI Statement about the research project. Correspondence
concerning the Investigators’ Report may be addressed to Dr. Zorana
Jovanovic Andersen, Section of Environmental Health, Department of Public
Health, University of Copenhagen, Øster Farimagsgade 5, 1353
Copenhagen, Denmark; email:
zorana.andersen@sund.ku.dk. No
potential conflict of interest was reported by the authors.
Although this document was produced with partial funding by the United States
Environmental Protection Agency under Assistance Award CR–83998101 to
the Health Effects Institute, it has not been subjected to the
Agency’s peer and administrative review and therefore may not
necessarily reflect the views of the Agency, and no official endorsement by
it should be inferred. The contents of this document also have not been
reviewed by private party institutions, including those that support the
Health Effects Institute; therefore, it may not reflect the views or
policies of these parties, and no endorsement by them should be
inferred.
Early ecological studies have suggested a link between air pollution and
Coronavirus Diseases 2019 (COVID-19*); however, the evidence from individual-level
prospective cohort studies is still sparse. Here, we have examined, in a
general population, whether long-term exposure to air pollution is
associated with the risk of contracting severe acute respiratory syndrome
coronavirus 2 (SARS-CoV-2) and developing severe COVID-19, resulting in
hospitalization or death and who is most susceptible. We also examined
whether long-term exposure to air pollution is associated with
hospitalization or death due to COVID-19 in those who have tested positive
for SARS-CoV-2.
Methods
We included all Danish residents 30 years or older who resided in Denmark on
March 1, 2020. and followed them in the National COVID-19 Surveillance
System until first positive test (incidence), COVID-19 hospitalization, or
death until April 26, 2021. We estimated mean levels of nitrogen dioxide
(NO2), particulate matter with an aerodynamic diameter
<2.5 μm (PM2.5), black carbon (BC), and ozone
(O3) at cohort participants’ residence in 2019 by the
Danish Eulerian Hemispheric Model/Urban Background Model. We used Cox
proportional hazard models to estimate the associations of air pollutants
with COVID-19 incidence, hospitalization, and mortality adjusting for age,
sex, and socioeconomic status (SES) at the individual and area levels. We
examined effect modification by age, sex, SES (education, income, wealth,
employment), and comorbidities with cardiovascular disease, respiratory
disease, acute lower respiratory infections, diabetes, lung cancer, and
dementia. We used logistic regression to examine association of air
pollutants with COVID-19–related hospitalization or death among
SARS-CoV-2 positive patients, adjusting for age, sex, individual- and
area-level SES.
Results
Of 3,721,810 people, 138,742 were infected, 11,270 hospitalized, and 2,557
died from COVID-19 during 14 months of follow-up. We detected strong
positive associations with COVID-19 incidence, with hazard ratio (HR) and
95% confidence interval (CI) of 1.10 (CI: 1.05–1.14) per
0.5-μg/m3 increase in PM2.5 and 1.18 (CI:
1.14–1.23) per 3.6-μg/m3 increase in
NO2. For COVID-19 hospitalizations and for COVID-19 deaths,
corresponding HRs and 95% CIs were 1.09 (CI: 1.01–1.17) and 1.19 (CI:
1.12–1.27), respectively for PM2.5, and 1.23 (CI:
1.04–1.44) and 1.18 (CI: 1.03–1.34), respectively for
NO2. We also found strong positive and statistically
significant associations with BC and negative associations with
O3. Associations were strongest in those aged 65 years old or
older, participants with the lowest SES, and patients with chronic
cardiovascular, respiratory, metabolic, lung cancer, and neurodegenerative
disease. Among 138,742 individuals who have tested positive for SARS-Cov-2,
we detected positive association with COVID-19 hospitalizations
(N = 11,270) with odds ratio and 95% CI of 1.04 (CI:
1.01– 1.08) per 0.5-μg/m3 increase in
PM2.5 and 1.06 (CI: 1.01–1.12) per
3.6-μg/m3 increase in NO2, but no
association with PM with an aerodynamic diameter <10 μm
(PM10), BC, or O3, and no association between any
of the pollutants and COVID-19 mortality (N = 2,557).
Conclusions
This large nationwide study provides strong new evidence in support of
association between long-term exposure to air pollution and COVID-19.
INTRODUCTION
One of the important public health objectives in the midst of COVID-19 epidemic was
to identify key modifiable factors that could contribute to increased risk of
contracting the SARS-CoV-2 and developing COVID-19 or worsen the severity of the
health outcomes among individuals with COVID-19. These factors are crucial for the
management of the current COVID-19 pandemic and preparation of strategies for future
similar pandemics. Air pollution is the major environmental stressor and is the
fourth top ranked global risk factor for morbidity and mortality (after smoking,
high blood pressure, and poor diet). It caused 6.7 million deaths in 2019, from
ischemic heart disease, cerebrovascular disease, chronic obstructive pulmonary
disease, acute lower respiratory infections, lung cancer, diabetes, and neonatal
deaths (HEI 2020).
AIR POLLUTION AND COVID-19: IS THERE A BIOLOGICAL PLAUSIBILITY?
Several biologically plausible mechanisms and pathways may explain how long-term
exposure to particulate matter (PM) and gaseous pollutants may increase risk of
COVID-19. Long-term exposure to air pollution may worsen COVID-19 severity and
lethality indirectly, by increasing the risk of respiratory, cardiovascular, and
metabolic diseases as well as lung cancer (HEI 2020), which in turn increase the risk of severe disease and death
from COVID-19 (Atkins et al. 2020;
Elliott et al. 2021; Veronesi et al.
2022; Williamson et al. 2020).
Experimental studies show that PM exposure can also directly increase
vulnerability to the SARS-CoV-2 and other respiratory infections by impairing
cell immunity and weakening host defense mechanisms, and thus increasing
susceptibility to respiratory infections (Woodby et al. 2021). This increased vulnerability is caused by direct
cellular damage and indirectly via oxidative stress and inflammation in the lung
and system, which can increase viral spread, enhance virus-induced tissue damage
and inflammation, promoting dysfunction of a variety of organs, including the
lungs, heart, kidney, and brain, resulting in more severe COVID-19 or death
(Woodby et al. 2021).
Furthermore, the plausibility of the link between air pollution and COVID-19 is
supported by the likely link between air pollution with other respiratory
infections, such as pneumonia. Only a few studies have examined associations
between long-term exposure to air pollution and pneumonia incidence or
hospitalizations (Carey et al. 2016;
Neupane at el. 2010; Salimi et al.
2018), with mixed results, as two
reported positive associations (Carey et al. 2016; Neupane at el. 2010)
and one found no association (Salimi et al. 2018). Based on these three studies, recent systematic review and
meta-analyses from the Health Effects Institute (HEI) on the associations
between traffic-related air pollution (including NO2,
PM2.5, and elemental carbon [EC]) and a number of health
outcomes, we have concluded that the confidence was very low or low for an
association with traffic-related air pollution and the risk of acute lower
respiratory infections (Boogaard et al. 2020). However, the Global Burden of Disease study has recognized
the causal link between air pollution and acute lower respiratory infection
mortality (HEI 2022), which is supported by solid evidence from 13 studies on
air pollution and pneumonia mortality (Bowe et al. 2019; Carey et al. 2013; Jerrett 2022;
Katanoda et al. 2011; Kazemiparkouhi et
al. 2020; Lim et al. 2019; Liu et al. 2022; Pinault et al. 2017; Pope et al. 2004,
2019; Turner et al. 2016; Yang et al. 2018; Yorifuji et al. 2013) of which all but one (Carey et al. 2013) detected associations.
EARLY RESEARCH ON LONG-TERM EXPOSURE TO AIR POLLUTION AND COVID-19:
CORRELATION AND ECOLOGICAL STUDIES
Early correlation and ecological studies have raised headlines suggesting that
air pollution may increase the risk of COVID-19, despite the fallacies of such
designs (Villeneuve and Goldberg 2020).
A study in the United States gained instant attention by the media in May 2020,
when preliminary (non–peer-reviewed) results by Wu and colleagues (Wu et
al. 2020) showed that even a small
increase of 1 μg/m3 in long-term exposure to PM2.5
led to a large 20% increase in the COVID-19 death rate, with the magnitude of
increase 20 times that observed for PM2.5 and all-cause mortality (Di
et al. 2017). This impressive estimate
later attenuated to 8%, after adjustment for the timing of social distancing
policies and the population’s age distribution. However, this study was
criticized for possibly grossly overestimating the effect of air pollution on
COVID-19 mortality for several reasons. The major issue is the ecological
design, where mortality rates in 3,080 U.S. counties were compared against very
crude, county-average concentrations of PM2.5 over a 17-year period,
and lacked individual-level data on exposure, outcome, and important confounders
(SES, lifestyle, and comorbidities). The majority of early studies on long-term
exposure to air pollution and COVID-19 used ecological designs, which have
typically linked mean air pollution levels over an area (county, municipality,
postal code areas, region, etc.) to the COVID-19 death or COVID-19 case-fatality
rates in that area.
Here we give examples of results from selected studies (Liang et al. 2020; Travaglio et al. 2021) to illustrate inconsistencies in
findings from the same areas or countries and to call for careful interpretation
of these early results. Following Wu and colleagues, another nationwide U.S.
study, based on the same county-level data as the study by Wu and colleagues but
utilizing a different air pollution modeling approach, examined the long-term
effect of NO2, PM2.5, and O3 on COVID-19 case
fatality and mortality rates. They reported increases of 7.1% (CI:
1.2%–13.4%) and 11.2% (CI: 3.4%–19.5%) per 4.5-ppb increase in
NO2 for case fatality and mortality rate, respectively (Liang et
al. 2020). Notably, in contrast to Wu
and colleagues, Liang and colleagues reported no association with
PM2.5. Similarly, two ecological studies from England on
long-term exposure to air pollution and COVID-19 mortality show somewhat
conflicting results, notably using the different spatial units for analyses and
different statistical approaches. A study based on COVID-19 deaths up to June
30, 2020 aggregated in Lower Layer Super Output Area spatial units
(N = 32,844) found a 0.5% (95% credible interval:
–0.2%–1.2%) and 1.4% (CI: –2.1%–5.1%) increase in
the COVID-19 mortality rate for every 1-μg/m3 increase in
NO2 and PM2.5, respectively (Konstantinoudis et al.
2021). On the other hand, Travaglio
and colleagues reported a significant association between long-term exposure to
NO2 and O3 and COVID-19 deaths at the regional level
(Lower Tier Local Authorities), and none with PM2.5 (Travaglio et al.
2021).
In summary, early evidence based on long-term exposure to air pollution and
susceptibility to COVID-19 is limited by ecological study design, for which
estimates cannot be used to make inferences on individual-level risk, resulting
in the ecological fallacy (Villeneuve and Goldberg 2020). Individual-level data are needed to provide valid
inference in understanding the impact of air pollution on contracting the
SARS-CoV-2 and the development of the COVID-19 disease. Notably, many of the
aforementioned studies have been published ahead of peer review, calling for
extra caution when drawing inference from these early results, as pointed out in
an editorial (Heederik et al. 2020).
LONG-TERM EXPOSURE TO AIR POLLUTION AND COVID-19: CORRELATION AND ECOLOGICAL
STUDIES
Epidemiological evidence based on the cohort studies with individual-level data
on long-term exposure to air pollution and later onset of COVID-19 is still very
sparse and mixed. Travaglio and colleagues, as the first at that time, used
individual-level data on “infectivity” from the UK Biobank, where
of the 1,450 tested individuals 699 tested positive for SARS-CoV-2 and found
that a single-unit increase in PM2.5 levels was associated with a
statistically significant 12% increase in COVID-19 cases in contrast to their
above mentioned results on regional analyses (Travaglio et al. 2021). Only three studies examined
association of long-term exposure to air pollution to COVID-19 incidence in the
general population, where incidence was defined as the first positive SARS-CoV-2
test, and they offer mixed results. In a city-wide study of 62,848 residents of
Varese, Italy, of whom 4,408 tested positive for COVID-19 in first year of the
pandemic, Veronesi and colleagues detected increases of 5.1%, 2%, and 4% in
COVID-19 rates for each μg/m3 increase in PM2.5,
NO2, and PM10, respectively (Veronesi et al. 2022). In 424,721 subjects from UK
Biobank, of whom 10,790 tested positive between March 16 and December 31, 2020,
Sheridan and colleagues detected associations with odds ratios (ORs) of 1.06 and
1.05 for COVID-19 incidence for each 1.3- and 9.9-μg/m3
increase in PM2.5 and NO2, respectively, but found no
associations with PM10, and no association of any pollutants with
COVID-19 hospitalizations (N = 1,598) or deaths
(N = 568) (Sheridan et al. 2022). In 1,594,308 subjects from Rome, of whom 79,976
tested positive and 2,656 died from COVID-19 between January 1, 2020, and April
15, 2021, Nobile and colleagues on the other hand, found no associations with
COVID-19 incidence, but reported 8% and 9% higher risk of dying from COVID-19
for each 0.92- and 9.22-μg/m3 increase in PM2.5 and
NO2, respectively (they had no data on PM10) (Nobile
et al. 2022). In a slightly different
approach, a study by Kogevinas and colleagues, which was based on 9,605 subjects
from the COVID-19 cohort of Catalonia (COVICAT) study in Barcelona who provided
detailed questionnaire data on COVID-19 and of whom 481 (5%) had COVID-19,
reported associations with PM2.5 and NO2, but none with
BC. In a subset of 4,103 subjects who provided blood samples, they found no
association of air pollution with positive antibodies for SARS-CoV-2 (mix of
incidence and prevalence), but also here, detected associations with incidence
based on self-reported COVID-19. Kogevinas and colleagues have notably reported
stronger associations with air pollution with increasing severity of COVID-19
outcome, in terms of COVID-19 severe symptoms, hospitalization, or death
(Kogevinas et al. 2021).
Four studies, all from North America, which had access to data only on those who
tested positive for COVID-19, examined whether long-term exposure to air
pollution affects COVID-19 prognosis, in terms higher risk of hospitalizations,
intensive care unit admissions, or death that is related to COVID-19. All of
these studies have detected an association between PM2.5 and the risk
of severe COVID-19 outcomes, including hospitalizations (Bowe et al. 2021; Chen et al. 2022; Mendy et al. 2021), intensive care unit visits (Bozack et al. 2022; Chen et al. 2022), or death (Bozack et al. 2022; Chen et al. 2022).
The internationally unique infrastructure of the Danish population and health
registries, has access to highly precise historical residential address
histories, estimates of air pollution for more than 40 years, COVID-19 deaths
and hospitalization data, as well as SES and comorbidity data at the individual
level for the entire Danish population. This infrastructure provides a framework
that can directly address the limitations of the ecological approach and those
from other individual-level studies, particularly selection of subjects who have
access to polymerase chain reaction (PCR) testing, with sufficient control for
confounding, and collinearity between population density and exposure. This
research was designed to provide new, high quality data to support the rapidly
emerging evidence base on the potential association between long-term exposure
to air pollution and susceptibility to COVID-19. The evaluation of this evidence
will be crucial for the scientific and public health community and policymakers
in their work in mitigating risk and developing solutions during the global
COVID-19 crisis.
SPECIFIC AIMS
Here we aim to investigate whether long-term exposure to air pollution is associated
with increased risk of mortality and morbidity related to COVID-19 and to identify
the most susceptible groups by age, sex, SES, ethnicity, and comorbidities. Specific
aims:
Examine whether long-term exposure to PM2.5, PM10,
NO2, BC, and O3 are associated with the risk of
contracting COVID-19, in terms of COVID-19 incidence, hospitalizations, or
death in the general population.
Identify subgroups that are susceptible to air pollution– related
COVID-19 morbidity and mortality by age, sex, SES (education, individual
income, household income, wealth, occupational status, civil status, housing
tenure, and household size, type, and composition), ethnicity (Danish as
well as non-Western and Western origin), and comorbidity (cardiovascular
disease, respiratory disease, acute lower respiratory infections, lung
cancer, diabetes, and dementia).
Examine whether long-term exposure to PM2.5, PM10,
NO2, BC, and O3 are associated with poorer
prognosis in people who tested positive for COVID-19, in terms of higher
risk of hospitalization and mortality.
METHODS AND STUDY DESIGN
STUDY POPULATION
We created a population-based nationwide cohort called the “Long-term
exposure to AIR pollution and COVID-19 mortality and morbidity in
DENmark” (AIRCODEN) by including all Danish residents who were 30 years
or older on March 1, 2020 and had lived
in Denmark for at least 1 year prior to this date.
COVID-19 OUTCOME DEFINITIONS
Danish Statens Serum Institut, under the Danish Ministry of Health, is
responsible for the Danish preparedness against infectious diseases and is in
charge of surveillance of the COVID-19 pandemic in Denmark. The surveillance of
the COVID-19 infections is based on the results of the tests from
microbiological departments at the Danish hospitals and testing centers, and
from Statens Serum Institut’s own laboratory, which are collected
centrally in the Danish Microbiological Database (https://miba.ssi.dk/service/english). Data include
results from PCR tests for the COVID-19 virus. We obtained data on COVID-19 from
the Danish Health Data Authority, notably with a 5-month delay due to COVID-19
lockdown measures, which slowed down processing of the data for research.
The COVID-19 data available for researchers at the Danish Health Authority
include information on COVID-19 test date, test result, hospital admission date,
place of death, death date, international travel prior to admission/death, and
country of travel. A detailed description of the available data is provided in
Table A1 in Appendix A
(available on HEI website). The Statens Serum Institut and Danish
Health Ministry note that researchers should be aware of two important facts
regarding the use of Danish COVID-19 data in research: (1) that COVID- 19
surveillance data are dynamic in that the Statens Serum Institut worked
continuously to improve their surveillance algorithms, which may have resulted
in changes to their algorithms during the time of this study (there were no
major changes in algorithm relevant for the analyses of COVID-19 incidence,
hospitalization, or death data in this project), and (2) that changes in test
strategy affect the population in that COVID-19 data are affected by a
continuous change in the testing strategy, which implies that the population of
those with confirmed COVID-19 infections cannot be compared over time.
Using unique personal identification numbers, we linked the AIRCODEN cohort
participants with the Danish National COVID-19 Surveillance System database. PCR
testing in Denmark was offered to all citizens, free of charge and easily
accessible, thus providing a unique opportunity to trace COVID-19 infection in
all Danish residents — though, notably with very poor testing capacity in
the first wave and much larger testing capacity in the second pandemic wave
starting on August 1, 2020 (Figure
1). We defined COVID-19 outcomes as incidence (first
positive PCR test for SARS-CoV-2), hospitalization (hospital admission for more
than 12 hours within 14 days after the first positive PCR test for SARS-CoV-2),
and death (death within 30 days of the detection of SARS-CoV-2 infection). Note
that the statistics on COVID-19 fatalities include deaths recorded within 30
days of the detection of COVID-19 infection in the individual, but that COVID-19
is not necessarily the underlying cause of death. We also defined death from any
cause as an additional outcome, in order to compare the size of association
between air pollution and COVID-19 with that for all-cause mortality, recently
reported in the nationwide Danish cohort from year 2000.
The COVID-19 pandemic in Denmark between March 1, 2020, and April
26, 2021. Daily numbers of COVID-19 positive cases, hospital
admissions, and deaths in Denmark.
In this report, we refer to SARS-CoV-2 as the virus and to COVID-19 as the
disease manifestation in those who contracted SARS-CoV-2. In this project we
were mainly interested in air pollution association with the risk of COVID-19
(i.e., the disease resulting from infection of SARS-CoV-2), keeping in mind that
it is possible to have asymptomatic SARS-CoV-2 infection (i.e., infection
without diseases, symptoms, etc.). Thus, we defined three possible definitions
of the COVID-19: incidence (positive test for SARS-CoV-2, since we do not have
data to separate asymptomatic SARS-CoV-2 cases and those who developed diseases
COVID-19), hospitalization, and mortality.
COVARIATE AND COMORBIDITY DEFINITIONS
We have extracted individual-level SES information for year 2019 from the Danish
national registers with information on individual SES for all Danish citizens,
including occupation, personal income and transfer of welfare payments
(Baadsgaard and Quitzau 2011), personal
labor market affiliation (Petersson et al. 2011), and education (Jensen and Rasmussen 2011), as well as civil status, household composition,
and country of origin available from the Danish Civil Registration System
(Schmidt et al. 2014). The following
individual-level variables were defined based on the register data from
2019:
Marital status (married/registered partnership; divorced; widow/widower;
single)
Highest completed education (primary/basic education; vocational
training; short higher education; medium higher education; long higher
education — college or higher)
Occupational status (primary, upper secondary, vocation/qualifying,
vocation bachelor/short higher education, college level or higher)
Individual wealth, in tertiles (the approximate difference between all
assets and liabilities in DKK/year)
Family/household disposable income, in tertiles (DKK/ year)
Household size (one, two, three, four, five or more persons living in
household)
The following area-level/neighborhood variables were defined at parish level
defined from the register data for year 2019:
Population density (number of people/km2)
Mean income (DKK/year)
Median wealth (DKK/year)
Percent unemployment
Percent primary or lower education
Corresponding SES (including mean income, median wealth, percent
unemployment, and percent primary or lower education) difference between
municipality and parish
Municipality-level access to healthcare (number of general
practitioners/citizens)
Lung cancer incidence rate (proxy for parish smoking rates)
Diabetes incidence rate (proxy for parish obesity rates)
In Denmark there are 5 regions, 98 municipalities, and 2,158 parishes. The five
regions are the Capital Region (29 municipalities), Southern Denmark Region (22
municipalities), Central Denmark Region (19 municipalities), Zealand Region (17
municipalities), and North Denmark (11 municipalities). In Denmark, a parish is
a local ecclesiastical unit in the Church of Denmark. Each parish is assigned to
a physical church, and the church’s administration handles the
area’s civic registration of births, marriages, and deaths. Each Danish
municipality is composed of one or more parishes.
Ethnicity was defined by country of origin (Denmark; Western countries [all 28
European Union countries and Andorra, Iceland, Liechtenstein, Monaco, Norway,
San Marino, Switzerland, Vatican State, Canada, the United States, Australia,
and New Zealand]; and non-Western [all others]).
Comorbidities (i.e., the prevalence of a specific disease) were defined as a
record of hospital contact (inpatient, outpatient, or emergency) in the Danish
National Patient Register (Schmidt et al. 2015) for that specified disease prior to AIRCODEN baseline on March
1, 2020, as defined in Table
1. Note that we had data from the Danish National Patient
Register available from the onset of the register in 1979 until December 31,
2018.
AIR POLLUTION EXPOSURE
We used the Danish integrated Danish Eulerian Hemispheric Model (DEHM)/Urban
Background Model (UBM) estimates of annual means of NO2,
PM2.5, PM10, BC, and O3 at a 1×1 km
resolution from 1979–2019, assigned to residential addresses of AIRCODEN
cohort participants. The DEHM is a chemistry-transport model (Brandt et al.
2012), and the UBM (Brandt et al.
2003) includes several domains with
different spatial resolutions to calculate intercontinental and regional
transport of air pollution, while achieving a high resolution over Denmark. The
models were validated against measurements and showed good performance
(Hvidtfeldt et al. 2018; Khan et al.
2019). The main exposure proxy used
was a 1-year mean exposure at residence in 2019, as seen on Figure 2, and additional
analyses was performed with 3-year (2017–2019) and 10-year mean exposure.
We defined these three exposure windows to examine whether more recent exposure
to air pollution (in 2019, a year before pandemic) or the accumulation of
exposure over a long period of time for up to ten years, were the most relevant
for the risk of contracting SARS-CoV-2.
Annual mean parish levels of PM2.5, NO2, BC,
and O3 in 2019 in Denmark. BC = black carbon;
NO2 = nitrogen dioxide; O3 = ozone;
PM2.5 = particulate matter with diameter ≤2.5
μm.
Traffic-related pollutants NO2 and BC are highest in Denmark in the
urban areas, whereas O3 is highest at the rural and coastal areas
(Figure 2). Apart from high levels
of PM2.5 in urban areas, levels are also high in Southeastern Denmark
due to significant contribution of long-range transported secondary particles
from Central and Eastern Europe.
We also used the European-wide hybrid land use regression (LUR) model, developed
within the Effects of Low-Level Air Pollution: A Study in Europe (ELAPSE)
project (http://www.elapseproject.eu/), which provides
annual mean concentrations of PM2.5, NO2, BC, and
O3 for the year 2010 at a 100×100-m resolution, (de Hoogh
et al. 2016) and which has been used in
other studies on air pollution and all-cause mortality in Europe and Denmark. In
brief, the LUR model utilized routine monitoring data from the European
Environment Agency AirBase for PM2.5 and NO2, and European
Study of Air Pollution Effects (ESCAPE) monitoring data for BC as the dependent
variable. Satellite data, dispersion model estimates, land use, and traffic
variables were predictors to estimate annual mean pollutant concentrations. The
models performed well in five-fold hold-out validation, explaining 72%, 59%, and
54% of spatial variability of the measured concentrations for PM2.5,
NO2, and BC, respectively (de Hoogh et al. 2018). We used the ELAPSE model in addition to the Danish
model to test whether our results were robust to different methods of estimating
long-term exposure to air pollution.
STATISTICAL METHODS AND DATA ANALYSIS
LONG-TERM EXPOSURE TO AIR POLLUTION AND COVID-19 INCIDENCE, HOSPITALIZATION,
AND MORTALITY
We used stratified Cox proportional hazard models with calendar time in days as
the underlying timescale to examine the associations of air pollutants
(single-pollutant models) with COVID-19 incidence, hospitalization, death, or
all-cause mortality, with censoring at the date of death from other reasons,
emigration, or the end of follow-up on April 26, 2021, whichever came first. We
fitted three models with increasing control for the individual- and area-level
covariates: Model 1, which adjusted for the calendar time (time axis), age
(strata by 5-year age band), sex (strata), and region of residence (strata)
(region was not included in all-cause mortality analyses); Model 2, which
additionally adjusted for individual-level SES, including marital status
(unmarried, divorced, widowed, married/registered partnership), highest
completed education (primary, upper secondary, vocation/qualifying, vocation
bachelor/short higher education, college level or higher), occupational status
(unemployed, employed, or sick/ welfare support/student/pension/others),
individual wealth (tertile), family income (tertile), and household size (one,
two, three, four, five, and above persons living in household); and Model 3
(main model), which additionally adjusted for population-level SES including
parish-level population density, municipality-level access to healthcare,
parish-level SES factors (mean income, median wealth, percentage of
unemployment, percentage of primary or low education, and the SES difference
between municipality and parish). We have extensively adjusted for SES both at
individual- and area level because air pollution exposure and risk of COVID-19
are both related to SES. The Cox model is a standard model used to examine the
association between air pollution and health outcomes, which are assessed
prospectively in time-to-event format. To account for the spatial correlation of
observations within the same parish, we used the Huber sandwich estimator for
all models to robust the variance estimation.
We fitted single-pollutant models for annual mean exposure in 2019 (main
analyses) and for three-year (2017–2019) and ten-year (2010–2019)
means of PM2.5, PM10, NO2, BC, and
O3 estimated by the Danish DEHM/UBM model, as well as for 2010
annual mean of PM2.5, NO2, BC, and O3 estimated
by ELAPSE model. These different approaches were used to examine which exposure
window to air pollution may be most relevant for the immune response relevant
for infection by SARS-CoV-2: is it more recent exposures, captured best by the
annual mean exposure in 2019, or accumulated exposure over longer time, captured
by three- or ten-year mean exposure? We also conducted these analyses to test
robustness of our results to different modeling approaches used for estimating
exposures to air pollution.
Table 1.
Definition and Prevalence of Comorbidities Among the 3,721,813
Participants of the AIRCODEN Cohort at the Study Baseline on March 1,
2020a
a ICD-8/10: International Classification of Diseases
8th/10th version. ICD-8 was used before and ICD-10 after January 1,
1994 (ICD-9 was never implemented in Denmark).
To evaluate the shape of the associations for each pollutant and examine whether
there is a threshold below which air pollution does not pose a risk for
COVID-19, we have estimated exposure–response functions by applying
natural cubic splines with three degrees of freedom. To examine whether the
associations with air pollution may have changed over time during the study
period due to differences in testing capacity, stringency of lockdown measures,
compliance with lockdown and other (wearing masks, physical distancing,
compulsory testing, etc.) pandemic measures, as well as COVID-19 strains, we
estimated associations separately in two pandemic waves: March 1–July 31,
2020, and August 1, 2020–April 26, 2021.
We have aimed to identify groups of Danish residents who were most susceptible
and most likely to contract SARS-CoV-2 virus and develop COVID-19 due to air
pollution, by demographics, SES, and comorbidities. Specifically, effect
modification of an association of PM2.5 and NO2 with
COVID-19 incidence, hospitalization, and mortality by sex, age, individual-level
SES, ethnicity and comorbidities with cardiovascular disease, respiratory
disease, acute lower respiratory infections, diabetes, lung cancer, dementia,
and diabetes, were evaluated by entering an interaction term (one at the time)
into the model and tested by the Wald test at multiplicative scale. We fitted
mutually adjusted two-pollutant models for pollutant combinations for which the
Pearson correlation coefficient is less than 0.7.
We performed several sensitivity analyses. To evaluate possible confounding by
missing information on smoking and body mass index (BMI), which are not readily
available for the Danish population, we have additionally adjusted for
parish-level chronic obstructive pulmonary diseases or lung cancer prevalence
rates (proxies for smoking) and parish-level diabetes prevalence rates (proxy
for obesity). We have also applied the indirection adjustment (Shin et al. 2014) using the associations between air
pollution and smoking and BMI based on the Danish National Survey 2017, which
included data on 183,372 Danes who were 18 years and older. This survey is
considered to have the most representative data on Danish adult
populations’ lifestyle factors. To make the indirect adjustment, we have
linked the Danish National Survey participants to the air pollution estimates
(the Danish integrated DEHM/UBM model) at their residence in 2017, and then
estimated the association between lifestyle factors (e.g., smoking, BMI, and
physical activity) and different air pollutants. These effect estimates were
used to correct the effect estimates of the association between the specific air
pollutant and COVID-19 incidence, mortality, and hospitalization. We have
additionally performed sensitivity analyses of association between long-term
exposure to air pollution and COVID-19 incidence, hospitalization, and mortality
using Poisson regression instead of Cox regression, and estimated rate ratio
(RR).
The weakness of our approach is that not all Danish residents have been tested
for COVID-19, and that those who chose to get tested may be somehow different
from those who did not, and that results of this study are not generalizable to
the latter. Thus, to explore whether associations are affected by a possible
selection bias in who gets tested, we have estimated associations in a subsample
of population who were tested for COVID-19. Another issue with COVID-19 is that
there were fast-changing strategies in testing, such as population adaptation,
and lockdown-measures, which all may have had an impact on the effect of air
pollution on COVID-19. To examine whether changes in testing capacity and
prevention measures over time and space, in different parts of the country,
affected associations of air pollution with COVID-19, we used time-varying Cox
models with adjusting for covariates in Model 3 and monthly municipality-level
SARS-CoV-2–positive rate based on PCR tests. By estimating
SARS-CoV-2–positive rate every month in every municipality, we could
account for the development of the COVID-19 pandemic over space and time in
Denmark, and account for it in our analyses (Danesh Yazdi et al. 2021, Lin and Ying 1994).
Only subjects with complete information for Model 3 variables were included in
the analyses. We presented HRs and 95% CIs per interquartile range (IQR)
increase in pollutant. We conducted analyses using R statistical software
(version 4.1.2).
LONG-TERM EXPOSURE TO AIR POLLUTION AND COVID-19 HOSPITALIZATION AND
MORTALITY AMONG COVID-19 CASES
In this part of the analyses we examined whether in those who contracted
SARS-CoV-2, air pollution increased the risk of the development of more severe
COVID-19, requiring hospitalization or resulting in death. We used a logistic
regression model to examine the associations of air pollutants with COVID-19
hospitalization and death among 138,742 individuals who tested positive for
COVID-19. We fitted three models with increasing control for the individual- and
area level covariates: Model 1 adjusted for calendar time (natural spline with
eight degrees of freedom), sex, and age at baseline (5-year bands); Model 2
additionally adjusted for civil status, household size, individual wealth,
family income, education, and occupational status; and Model 3 further adjusted
for parish-level population density, mean income, median wealth, unemployment
rate, primary or low education rate, the difference of those variables between
parish and municipality, and municipality-level access to healthcare. We fitted
single-pollutant models for annual mean exposure in 2019 (main analyses), and
for a 3-year (2017–2019) mean of PM2.5, PM10,
NO2, BC, and O3 estimated by the Danish DEHM/UBM
model. The study was approved by the Danish Data Protection Agency.
RESULTS
Of the 3,743,013 AIRCODEN participants who were 30 years or older and resided in
Denmark on March 1, 2020, (and at least 1 year prior), we excluded 8,397 subjects
with missing data on air pollution exposure due to missing or incomplete geocoding
of residential address, 676 with missing data on individual SES information, and
12,127 subjects with missing parish-level SES information due to missing or
incomplete linkage between individual address and its parish. In addition, three
individuals were excluded from incidence and hospitalization analyses due to record
of SARS-CoV-2 positive test before March 1, 2020, leaving 3,721,813 subjects for
final analyses.
During 14 months follow-up (411–417 days) covering two pandemic waves (Figure 1), 138,742 individuals tested
positive for SARS-CoV-2, 11,270 were hospitalized, and 2,557 died from COVID-19.
Compared with the total population, subjects who died or were hospitalized from
COVID-19, or those who died from any cause, were less likely to be women, highly
educated, employed, married or live with a partner, or have high income (Table 2). However, reverse
patterns with less pronounced differences, were observed with incident COVID-19
cases. The vast majority (92% or 128,262 cases) of incident COVID-19 cases (or
SARS-CoV-2 positive tests) were observed in the second pandemic wave, whereas only
8% or 10,480 cases were observed during first wave. Correspondingly, 8,908 or 79% of
hospitalization, 1,921 or 75% of COVID-19 deaths, and 40,331 or 65% of deaths from
any causes were registered in the second wave.
Mean levels of PM2.5, NO2, and BC in 2019 were 7.43, 10.7, and
0.33 μg/m3, respectively, and were slightly higher in COVID-19
cases than in the total population (Table
2). The strongest positive correlation was observed between
NO2 and BC (0.75) and NO2 and PM2.5 (0.61), and
negative between NO2 and O3 (–0.86), and BC and
O3 (–0.68) (Figure
3). PM10 was poorly correlated with all other
pollutants.
Pearson correlation coefficients between annual mean air pollution
levels at residence in 2019 among the 3,721,813 participants of the
AIRCODEN cohort. BC = black carbon; NO2 = nitrogen
dioxide; O3 = ozone; PM10 and PM2.5 =
particulate matter with diameter ≤10 and ≤2.5 μm,
respectively).
We detected strong, significantly positive associations of 2019 annual exposure to
PM2.5, NO2, and BC with all three COVID-19 outcomes
(incidence, hospitalization, and mortality) (Table 3), mostly strongest for mortality. The
corresponding HRs and 95% CI from Model 3 were 1.23 (CI: 1.04–1.44) per
0.55-μg/m3 increase in PM2.5, 1.18 (CI:
1.03–1.34) per 3.49-μg/m3 increase in NO2, 1.06
(CI: 1.02–1.10) per 0.09-μg/m3 increase in BC, and 1.19
(CI: 1.07–1.33) per 1.14-μg/m3 increase in PM10.
Somewhat weaker (almost half of those observed with mortality), but still positive
and statistically significant associations were found for PM2.5 and
PM10 and COVID-19 incidence and hospitalizations, whereas
associations with NO2 and BC were almost identical for all three
outcomes. We found significant inverse associations of O3 with all three
COVID-19 outcomes and no association of either PM10 or O3 with
all-cause mortality. Associations with COVID-19 outcomes observed in the crude
model, adjusted for age, sex, and region (Model 1), remained largely unchanged when
adjusting for individual-level SES (Model 2), but attenuated substantially when
adjusting for area-level SES (Model 3). For all-cause mortality, estimates remained
almost identical in all three models. Compared with 1-year mean, associations with
COVID-19 were almost identical with 3-year (slightly stronger) and 10-year (slightly
weaker) exposure windows (Figure
4).
Table 2.
Characteristics Among the 3,721,813 Participants of the AIRCODEN Cohort at
the Study Baseline on March 1, 2020
The association between long-term exposure to air pollution and
COVID-19 incidence, hospitalization, and mortality, as well as all-cause
mortality, among the 3,721,813 participants of the AIRCODEN cohort using
three exposure windows [1-year mean (2019), 3-year mean
(2017–2019), and 10-year mean (2010–2019)]. HR =
hazard ratio; CI = confidence interval; BC = black carbon; NO2 =
nitrogen dioxide; O3 = ozone; PM10 and
PM2.5 = particulate matter with diameter ≤10 and
≤2.5 μm, respectively. Results are presented for interquartile
range increase: 0.55 μg/m3 for PM2.5, 3.49
μg/m3 for NO2, 0.09 μg/m3
for BC, 2.79 μg/m3 for O3, and 1.14
μg/m3 for PM10. Model adjusted for calendar
time (time axis), sex (strata), age at baseline (strata), and region
(strata); individual covariates (civil status, household size, individual
wealth, family income, education, and occupational status); and area-level
covariates (parish-level population density, mean income, median wealth,
unemployment rate, primary or low education rate, the differences of
socioeconomic variables between parish and municipality, and
municipality-level access to healthcare). Analysis for all-cause mortality
was not stratified by regions.
Air pollution estimated by the European ELAPSE model for year 2010 was higher than
air pollution estimated by the Danish DHEM/UBM model for year 2019 (Table 4), explained by
differences in the two modeling approaches as well as reduction in air pollution
since 2010. Air pollutants estimated by the ELAPSE model showed moderate-to-good
correlation with the Danish DEHM/UBM model, with correlation of 0.51 between
PM2.5 from two models, 0.63 for NO2, and 0.47 for both, BC
and O3 (Figure 5).
Analyses with ELAPSE model air pollutants showed strong and significantly positive
associations with all COVID-19 outcomes as well as with all-cause mortality,
comparable to those observed with the Danish DEHM/UBM model (Figure 6), although somewhat
weaker for PM2.5, NO2, and O3, and stronger for
BC.
Pearson correlation coefficients between air pollutants estimated by
DEHM/UBMD model in 2019 and the ELAPSEE model
in 2010 among the 2,205,957 participants of the AIRCODEN cohort who had
data on both exposures. BC = black carbon; NO2 =
nitrogen dioxide; O3 = ozone; and PM10 and
PM2.5 = particulate matter with diameter ≤10 and
≤2.5 μm, respectively.
The association between long-term exposure to air pollution and
COVID-19 incidence, hospitalization, and mortality, as well as all-cause
mortality among the 2,205,957 participants of the AIRCODEN cohort, using
DEHM/UBM model (blue) in 2019 and the ELAPSE model (red) in 2010.
HR = hazard ratio; CI = confidence interval; BC = black carbon;
NO2 = nitrogen dioxide; O3 = ozone; and
PM10 and PM2.5 = particulate matter with diameter
≤10 and ≤2.5 μm, respectively. Results are presented
for model-specific interquartile range (IQR) increase. For DEHM/UBM model
IQRs are: 0.6 μg/m3 for PM2.5, 3.3
μg/m3 for NO2, 0.1 μg/m3
for BC, 2.9 μg/m3 for O3; and for ELAPSE IQRs
are: 2.0 μg/m3 for PM2.5, 10.1
μg/m3 for NO2, 0.5 μg/m3
for BC, 4.1 μg/m3 for O3. Model adjusted for
calendar time (time axis), sex (strata), age at baseline (strata), and
region (strata); individual covariates (civil status, household size,
individual wealth, family income, education, and occupational status); and
area-level covariates (parish-level population density, mean income, median
wealth, unemployment rate, primary or low education rate, the differences of
socioeconomic variables between parish and municipality, and
municipality-level access to healthcare). Analysis for all-cause mortality
was not stratified by regions. N for morbidity analysis:
2,205,956 (one was excluded due to infection before baseline). Correlation
between DEHM/UBM and ELAPSE model: PM2.5 (0.51), NO2
(0.63), O3 (0.47), and BC (0.47).
Exposure–response functions were linear or curvilinear for the majority of the
pollutants and COVID-19 outcomes (Figure
7), in line with finding of generally stronger associations at
lower exposure ranges, well below current EU limit values of 25
μg/m3 for PM2.5 and 40 μg/m3 for
NO2 (Appendix Table
A2; available on the HEI website).
The shape of the associations between long-term exposure to air
pollution and COVID-19 incidence, hospitalization, and mortality, as
well as all-cause mortality among the 3,721,813 participants of the
AIRCODEN cohort. BC = black carbon; NO2 = nitrogen
dioxide; O3 = ozone; and PM10 and PM2.5 =
particulate matter with diameter ≤10 and ≤2.5 μm,
respectively. Model adjusted for calendar time (time axis), sex (strata),
age at baseline (strata), and region (strata); individual covariates (civil
status, household size, individual wealth, family income, education, and
occupational status); and area-level covariates (parish-level population
density, mean income, median wealth, unemployment rate, primary or low
education rate, the differences of socioeconomic variables between parish
and municipality, and municipality-level access to healthcare). Analysis for
all-cause mortality was not stratified by regions.
We found no associations in the first pandemic wave, but significant and positive
associations of PM2.5, NO2, and BC in the second pandemic wave
for all three COVID-19 outcomes (Figure
8). PM10 showed stronger associations in the first
pandemic wave. In the two-pollutant models, associations with NO2 and BC
were robust to adjustment for PM2.5, whereas those with PM2.5
attenuated to null with COVID-19 incidence and hospitalization and attenuated by a
half for mortality (Appendix Table
A3). Associations remained unchanged with three approaches for adjusting
for missing information on smoking and BMI (Appendix Figure A1) when limiting population to those who were
tested (Appendix Figure A2)
and when adjusting for spatiotemporal development of the epidemic via
municipality-level SARS-CoV-2 positivity rates (Appendix Table A4). Similarly,
our observed associations were almost identical when using Poisson regression
instead of Cox regression models (Appendix Table A5).
The association between long-term exposure to air pollution and
COVID-19 incidence, hospitalization, mortality, and all-cause mortality
among the 3,721,813 participants of the AIRCODEN cohort in two pandemic
waves: March 1–July 31, 2020 (red) and August 1,
2020–April 26, 2021 (blue). HR = hazard ratio; CI =
confidence interval; BC = black carbon; NO2 = nitrogen dioxide;
O3 = ozone; and PM10 and PM2.5 =
particulate matter with diameter ≤10 and ≤2.5 μm,
respectively. Results are presented for IQR increase: 0.55
μg/m3 for PM2.5, 3.49
μg/m3 for NO2, 0.09 μg/m3
for BC, 2.79 μg/m3 for O3, and 1.14
μg/m3 for PM10. Cochran’s Q test
were used to examine the statistical difference for the HRs observed in two
pandemic waves, and results with P value <0.05 are
highlighted with a star. Number of cases in the two pandemic waves: COVID-19
incidence (P1 = 10,480, P2 = 128,262); COVID-19 hospitalization (P1 = 2,362,
P2 = 8,908); COVID-19 mortality (P1 = 636, P2 = 1,921); and all-cause
mortality (P1 = 22,028, P2 = 40,331), where P1 is first pandemic wave and P2
is second pandemic wave.
Table 3.
The Association Between Long-Term Exposure to Air Pollution and COVID-19
Incidence, Hospitalization, and Mortality, as well as All-Cause Mortality
Among the 3,721,813 Participants of the AIRCODEN Cohorta,b
HR = hazard ratio; CI = confidence interval; BC = black carbon;
NO2 = nitrogen dioxide; O3 = ozone;
PM10 and PM2.5 = particulate matter with
diameter ≤10 and ≤2.5 μm, respectively.
a Results are presented for interquartile range increase: 0.55
μg/m3 for PM2.5, 3.49
μg/m3 for NO2, 0.09
μg/m3 for BC, 2.79 μg/m3 for
O3, and 1.14 μg/m3 for PM10.
Boldfaced text indicates statistically significant values with
P <0.05.
b Model 1 adjusted for calendar time (time axis), sex
(strata), age at baseline (strata), and region (strata); Model 2
additionally adjusted for civil status, household size, individual
wealth, family income, education, and occupational status; Model 3
further adjusted for parish-level population density, mean income,
median wealth, unemployment rate, primary or low education rate, the
difference of those variables between parish and municipality, and
municipality-level access to healthcare (analysis for all-cause
mortality was not stratified by regions).
cN = 3,721,810 (three people excluded due to COVID-19
infection before baseline on March 1, 2020).
Table 4.
Summary of the Air Pollution Level Estimated by DEHM/UBM Model in 2019 and
the ELAPSE Model in 2010 Among the Subset of 2,205,957 Participants of the
AIRCODEN Cohort Who Had Data on Both Exposures
BC = black carbon; NO2 = nitrogen dioxide; O3
=ozone; PM2.5 = particulate matter with diameter ≤2.5
μm; SD = standard deviation; IQR = interquartile range; DEHM/UBM
= Danish Eulerian Hemispheric Model/Urban Background Model; ELAPSE Model
= Effects of Low-Level Air Pollution: A Study in Europe.
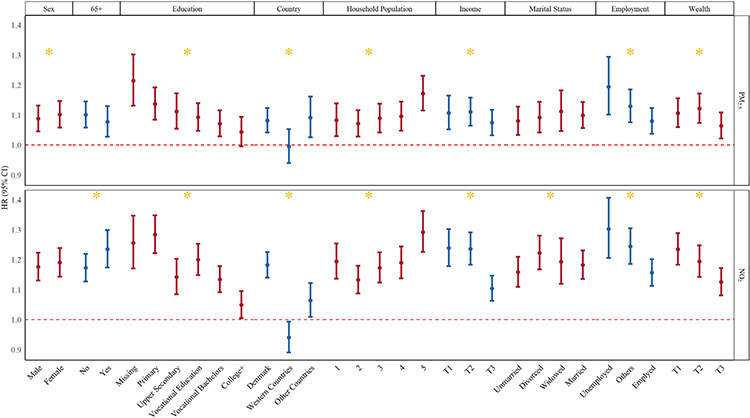
We found strongest associations of NO2 with COVID-19 incidence in the
those aged 65 years old or older, and of both PM2.5 and NO2 in
those with lowest education, income, and wealth, those who were unemployed, or
living in large households with five inhabitants or more (Figure 9). We also found strongest associations
in those who were born in Denmark and those from non-Western countries, whereas no
association was detected in those originating from Western countries. We found no
difference in associations between men and women. When considering comorbidities at
the study baseline, we found the strongest associations with both PM2.5
and NO2 in those with prior cardiovascular disease, which was most
pronounced for myocardial infarction and stroke, but also apparent for heart failure
and atrial fibrillation (Figure
10). We also detected stronger associations in those with prior
respiratory disease, although less pronounced in those with prior chronic
respiratory diseases (asthma and chronic obstructive pulmonary disease), and most
pronounced in those with prior acute lower respiratory infections, including
pneumonias and influenza. We notably found no associations with COVID-19 in lung
cancer patients. Finally, we found stronger associations in dementia and diabetes
patients, which were most pronounced for NO2 (Figure 10). The results for effect modification analyses
were almost identical for COVID-19 hospitalization (Appendix Figures A3 and A4), and similar for
mortality, although limited by small number of cases (Appendix Figures A5 and A6).
Effect modification of the association between long-term exposure to
air pollution and COVID-19 incidence among the 3,721,810 participants of
the AIRCODEN cohort by sex, age, and individual-level SES characteristic
at the cohort baseline on March 1, 2020. HR = hazard ratio; CI =
confidence interval; NO2 = nitrogen dioxide; and PM2.5
= particulate matter with diameter ≤2.5 μm. Results are
presented for IQR increase: 0.55 μg/m3 for
PM2.5 and 3.49 μg/m3 for NO2.
Wald test was used to calculate the global P value, and
results with P value <0.05 are highlighted with a
star.
Effect modification of the association between long-term exposure to
air pollution and COVID-19 incidence among the 3,721,810 participants of
the AIRCODEN cohort by comorbidities at the cohort baseline on March 1,
2020. HR = hazard ratio; CI = confidence interval; NO2
= nitrogen dioxide; PM2.5 = particulate matter with diameter
≤2.5 μm; CVD = cardiovascular disease; MI = myocardial
infarction; HF = heart failure; AF = atrial fibrillation; RD = respiratory
disease; COPD = chronic obstructive pulmonary disease; ALRI = acute lower
respiratory infections. Results are presented for IQR increase: 0.55
μg/m3 for PM2.5 and 3.49
μg/m3 for NO2. Wald test was used to
calculate the global P value, and results with
P value <0.05 are highlighted with a star.
LONG-TERM EXPOSURE TO AIR POLLUTION AND COVID-19 HOSPITALIZATION AND
MORTALITY AMONG COVID-19 CASES
Among 138,742 individuals who have tested positive for COVID-19, we detected
positive association with COVID-19 hospitalizations (N =
11,270), with OR and 95% CIs of 1.04 (CI: 1.01–1.08) per
0.5-μg/m3 increase in PM2.5 and 1.06 (CI:
1.01–1.12) per 3.6-μg/m3 increase in NO2,
and none with PM10, BC, or O3 (Table 5). These
associations with risk of severe COVID-19 among those who contracted SARS-CoV-2
were notably weaker than those detected with risk of contracting COVID-19 in
total population (Appendix
Figure A7). We found no associations between any of the pollutants
and COVID-19 mortality, except for negative association with
PM10.
DISCUSSION
In this large nationwide study in Danish residents 30 years old and older, we
detected strong associations between long-term exposure to PM2.5,
NO2, BC, and PM10, and risk of getting infected with
SARS-CoV-2, as well as getting hospitalized or dying from COVID-19. We found that
those aged 65 years or older and individuals with major chronic cardiovascular and
respiratory diseases, diabetes, dementia, and prior acute lower respiratory
infections, as well as those in lowest SES groups (unemployed, low education, wealth
or income) and those living in households with more than five people, were most
vulnerable to the harmful effects of air pollution. We also found that long-term
exposure to air pollution in those who were infected with COVID-19 moderately
increased risk of subsequent hospitalization, but not death.
LONG-TERM EXPOSURE TO AIR POLLUTION AND COVID-19 INCIDENCE, HOSPITALIZATION,
AND MORTALITY
Our findings generally agree with three other studies on long-term exposure to
air pollution and COVID-19 incidence, hospitalization, or mortality (Table 6), all of which
report associations with air pollution, though with somewhat inconsistent
findings on which COVID-19 outcomes were found to be related to air pollution
(Kogevinas et al. 2021; Nobile et al.
2022; Sheridan et al. 2022; Veronesi et al. 2022). Our results corroborate those of
Veronesi and colleagues who, in a study of 62,848 residents of Varese (of whom
4,408 tested positive for COVID-19 in the first year of the pandemic) detected
5.1% and 2% increases in COVID-19 rate for each unit (μg/m3)
increase in PM2.5 and NO2, respectively (Veronesi et al.
2022). In 424,721 subjects from the
UK Biobank (of whom tested 10,790 positive between March 16 and December 31,
2020), Sheridan and colleagues detected OR of 1.05 and 1.05 for COVID-19
incidence for each 1.3- and 9.9-μg/m3 increase in
PM2.5 and NO2, respectively, but in contrast to our
study, found no associations with COVID-19 hospitalizations (N
= 1,598) or deaths (N = 568) (Sheridan et al. 2022). In 1,594,308 subjects from Rome
(of whom 79,976 tested positive and 2,656 died from COVID-19 between January 1,
2020 and April 15, 2021), Nobile and colleagues have, on the other hand, found
no associations with COVID-19 incidence, but reported 8% and 9% higher risk of
dying from COVID-19 for each 0.92- and 9.22-μg/m3 increase in
PM2.5 and NO2, respectively (Nobile et al. 2022). Furthermore, our results agree
with those of Kogevinas and colleagues, who also found associations with
COVID-19 risk assessed in detail in a smaller sample of subjects, by blood serum
tests, self-reports, hospitalizations, and death (Kogevinas et al. 2021). Our finding of stronger
associations of PM2.5 and PM10 with increasing severity of
COVID-19 outcomes was also observed by Kogevinas and colleagues (Kogevinas et
al. 2021) and Nobile and colleagues
(Nobile et al. 2022) but not by
Sheridan and colleagues (Sheridan et al. 2022).
We detected very strong associations with COVID-19 — 10% increase in
incidence and 23% in COVID-19 mortality per 0.55-μg/m3
increase in PM2.5 — which was substantially stronger than
those observed in the abovementioned studies, but in line with early findings of
very strong associations with COVID-19 in general in literature and in early
ecological studies (Wu et al. 2020).
The estimate of risk for COVID-19 mortality in our study is 10 times greater
than that observed for PM2.5 and all-cause mortality (i.e., 23%
versus 2% per 0.55 μg/m3; Table 3). This is in line with Nobile and colleagues,
who also found eight times higher estimate for COVID-19 than for
non–COVID-19 deaths (8% vs. 1% per 0.92 μg/m3) in Rome
(Nobile et al. 2022).
Table 5.
The Association Between Long-Term Exposure to Air Pollution and COVID-19
Hospitalization, and Mortality Among the 138,742 Participants with
COVID-19 Infection in the AIRCODEN Cohorta,b
HR = hazard ratio; CI = confidence interval; BC = black carbon;
NO2 = nitrogen dioxide; O3 =ozone;
PM10 and PM2.5 = particulate matter with
diameter ≤10 and ≤2.5 μm, respectively.
a Results are presented for: 0.55 μg/m3
for PM2.5, 3.49 μg/m3 for
NO2, 0.09 μg/m3 for BC, 2.79
μg/m3 for O3, and 1.14
μg/m3 for PM10. Boldfaced text
indicates statistically significant values.
b Model 1 adjusted for calendar time trend (natural spline
with 8 degrees of freedom), sex, age at baseline (5-year bands);
Model 2 additionally adjusted for civil status, household size,
individual wealth, family income, education, and occupational
status; Model 3 further adjusted for parish-level population
density, mean income, median wealth, unemployment rate, primary or
low education rate, the difference of those variables between parish
and municipality, and municipality-level access to healthcare.
These strong associations may in part be explained by the residual confounding by
smoking, BMI, physical activity, alcohol use, and other lifestyle factors for
which we didn’t have data, and which have explained some, but not all, of
the association between air pollution and COVID-19 in the UK Biobank study
(Sheridan et al. 2022), which was the
only study of the above that had data on smoking and other lifestyle.
Furthermore, in addition to the lack of data on individual lifestyle factors,
these observed strong estimates are likely at least in part explained by
residual confounding due to missing adjustment for a number of other factors
related to the COVID-19 pandemic, such as patterns in access to COVID- 19
testing, viral spread over time and space and prevention efforts (lockdown
measures, physical distancing and facial mask recommendations, adherence to mask
and distancing measures, vaccinations, etc.). On the other hand, these strong
associations may be real, as we have reported earlier on considerably stronger
associations between long-term exposure to air pollution and all-cause mortality
in Denmark: a 14.1% increase in mortality for each 5-μg/m3
increase in PM2.5, compared with those associations observed in other
European countries that were part of ELAPSE study, which ranged from a 2.1%
increase in a Dutch cohort to a 7.6% increase in a Norwegian cohort (Stafoggia
et al. 2022). Furthermore, we found an
indication of a curvilinear exposure–response function, in line with
large studies based on low-exposure to air pollution from Europe and Canada
(Brauer et al. 2019; Stafoggia et al.
2022; Strak et al. 2021) and a recent meta-analyses on
studies of air pollution and mortality (Chen and Hoek 2020), suggesting stronger association in lower level
exposure, which would be expected in Denmark, as the location with the lowest
air pollution levels among the four others located in Italy, Spain, and the
United Kingdom (Kogevinas et al. 2021;
Nobile et al. 2022; Sheridan et al.
2022; Veronesi et al. 2022). Furthermore, our results of strong
associations with COVID-19 outcomes and all-cause mortality, based on the air
pollution data estimated by the Danish model, were remarkably consistent with an
alternative air pollution exposure model based on the ELAPSE project (Figure 6). Within ELAPSE project, with
this same exposure, we have previously documented strong associations of
PM2.5 with all-cause mortality in Europe in studies including
Danish data (Stafoggia et al. 2022;
Strak et al. 2021) and in Denmark in a
recent nationwide study using ELAPSE (So et al. 2022) in line with those reported here, supporting the
plausibility of our findings. Still, these large estimates of the association
between air pollution and COVID-19 mortality demand some caution in
interpretation until further research brings more data and clarity on the size
of this association.
Table 6.
Comparison of Our Results on Association Between Long-Term Exposure to
Air Pollution and COVID-19 Incidence, Hospitalization, and Mortality in
General Population to Those from Literature
Study Name
Pollutant and Mean Exposure
Sample Size/Population (follow-up
period)
N Cases
Result (HR or OR [95% CI])
COVID-19
INCIDENCE
Our study
PM2.5: 7.4
μg/m3 NO2: 10.7
μg/m3
3,721,813 Denmark, all residents
≥30 years (March 1, 2020 to April 26, 2021)
138,742
PM2.5: HR 1.10
(1.05–1.14) per 0.5a
μg/m3 NO2: HR 1.18
(1.14–1.23) per 3.5a
μg/m3
HR = hazard ratio; CI = confidence interval; OR = odds ratio. Our
results are from Model 3.
aThe HRs and ORs shown are for an interquartile range
increase.
We have also detected strong associations with NO2 of 18% increase in
both incidence and mortality per 3.6-μg/m3 increase, which are
in line with PM2.5 results. The associations are substantially
stronger than those observed in previous studies (Nobile et al. 2022; Sheridan et al. 2022; Veronesi et al. 2022). In two-pollutant models with
PM2.5 we find indications of stronger associations with
NO2 (Appendix
Table A3), which may suggest relevance of mainly traffic-dominated
sources for risk of contracting COVID-19. However, both Sheridan and colleagues
and Veronesi and colleagues reported that PM2.5 was driving
associations with COVID-19 incidence in two-pollutant models with
NO2, indicating that more data are needed to determine which air
pollution component is most relevant for COVID-19. We are the first study to
report an association with the traffic-related pollutant BC and COVID-19. Our
results showing a strong association of PM10 with COVID-19 incidence
were in agreement with Veronesi and colleagues (Veronesi et al. 2022), but in contrast to Sheridan and
colleagues, who found no association of COVID-19 incidence, hospitalizations, or
death with PM10 (Sheridan et al. 2022). Our finding of negative associations with O3 are
in line with Veronesi and colleagues, the only other study on COVID-19 incidence
with data on O3 (Veronesi et al. 2022), as well as with negative associations of O3 with
all-cause mortality observed in European studies (Stafoggia et al. 2022; Strak et al. 2021) and other Danish studies, both with the Danish
DEHM/UBM model (Raaschou-Nielsen et al. 2020) and ELAPSE model (So et al. 2022).
Who Is Most Susceptible?
We present novel results indicating increased vulnerability to air pollution
with respect to risk of developing COVID- 19 of those with lowest SES. These
findings likely partially capture indirectly impact of lifestyle factors
associated with low SES, such as smoking, obesity, and low physical
activity, for which we did not have data in this study, but which have been
linked with increased risk of COVID-19. In addition, individuals with lower
SES were likely more exposed to COVID-19, as they are more likely to work in
occupations that were exempt from lockdown and working from home, such as
cleaning workers, service workers in supermarkets, bus drivers, security
workers, etc. We present novel results on enhanced vulnerability to air
pollution among those living in large households, with at least five
inhabitants, also related to higher risk of infection and/or higher doses of
virus. We also present results of vulnerability in older people and people
with chronic diseases. Veronesi and colleagues is the only study that has
considered effect modification of association between PM2.5 and
risk of COVID-19 by a number of clinical conditions, and found no
significant associations with any of them, but acknowledged lack of
statistical power and low number of cases. Veronesi and colleagues did
notably find indications of stronger associations of PM2.5 with
COVID-19 incidence in coronary heart disease and obstructive lung disease
patients, which were in line with our findings (Veronesi et al. 2022). For individuals with major
chronic diseases that have previously been linked to air pollution an
increased susceptibility to the harms of air pollution of makes biological
sense because air pollution has been linked to increased risk of the vast
majority of these diseases.
Association Between Long-Term Exposure to Air Pollution and COVID-19 in
Different Waves of the Pandemic
We found that associations of air pollution with COVID- 19 were strongest and
limited to the second pandemic wave (Figure 8). The two pandemic waves in Denmark were substantially
different and comparison of the results from the two demands some caution.
The second pandemic wave was the period when testing capacity was
considerably higher than in the first wave, resulting in much a higher
incidence rate, whereas hospitalization and death rates were more comparable
in two waves, though still higher in the second wave. These differences are
explained by the different phases of COVID-19 prevention measures and
differences in personal behavior and lifestyle. The second pandemic wave in
Denmark was characterized by a large improvement in testing capacity
(testing was offered only to those with severe symptoms in the first wave)
and tests were free of charge to all, by the introduction of masks, and by
the reopening of society (e.g., opening of work places, restaurants,
theaters, and cinemas conditional on a negative test result). These
differences imply that only very limited subset of COVID-19 cases was
detected in the first pandemic wave — those who traveled to Denmark
from hot spot areas abroad (e.g., the ski areas in Italy and the countries
of Austria and China) early in the pandemic, those presenting serious
symptoms, and close contacts (family) to those infected. It is likely that
these infections were not driven by air pollution. These were early cases
from early phases of pandemic, in a completely closed society, and these
early clusters of infection of highly new infectious virus were likely
spreading by other mechanisms, mainly close contact. In contrast, in the
second wave, when society had completely reopened and testing was introduced
for all, virus infection took its natural course and many more people were
infected, and a fraction of these infections seemed to be driven by
compromised immunity associated with air pollution. Another likely
explanation may be found in the COVID-19 variant, as the delta variant
dominated the second wave. However, two studies from Italy (Nobile et al.
2022; Veronesi et al. 2022) report consistent associations
across different pandemic waves, notably with much poorer testing capacity
in Italy and incidence definitions that differed from our study. Still, some
caution in interpreting our results is needed, and more data and research is
needed to confirm these possible explanations for our findings.
LONG-TERM EXPOSURE TO AIR POLLUTION AND COVID-19 HOSPITALIZATION AND
MORTALITY AMONG COVID-19 CASES
Our finding of an association between long-term exposure to air pollution and
COVID-19 prognosis in COVID-19 patients in terms of hospitalization risk, but
not mortality, generally agrees with four other studies in COVID-19 patients,
all from the United States (Bowe et al. 2021; Bozack et al. 2022;
Chen et al. 2022; Mendy et al. 2021). In a study of 169,102 U.S.
military veterans who tested positive for COVID-19, Bowe and colleagues detected
a 10% higher risk of hospitalization (N = 25,422, followed from
March 2, 2020 to January 31, 2021) for each 1.9-μg/m3 increase
in PM2.5 (Bowe et al. 2021).
In a study of 14,783 COVID-19 patients diagnosed at the University of Cincinnati
healthcare system, of whom 13.6% were hospitalized between March 13 and
September 30, 2020, Mendy and colleagues detected an 18% increased risk of
hospitalization for each 1-μg/m3 increase in PM2.5
(Mendy et al. 2021). In a study of
74,915 individuals who received COVID-19 diagnoses from Kaiser Permanente
Southern California between March 1 and August 31, 2020, Chen and colleagues
detected a 24% higher risk of hospitalization (N = 4,752), a
32% higher risk for intensive care unit admission (N = 1,125),
a 33% higher risk of intensive respiratory support (N = 1,125),
and a 14% higher risk of death (N = 1,107) for each
1.5-μg/m3 increase PM2.5 (Chen et al. 2022). Our finding of a 4% increase in
risk of hospitalization per 0.5-μg/m3 increase
PM2.5 agrees rather well with these studies — slightly
stronger than those presented by Bowe and colleagues and somewhat weaker than
those presented in Mendy and colleagues and Chen and colleagues. In a slightly
different approach, Bozack and colleagues studied 6,524 COVID-19 patients
admitted to one of the seven New York City hospitals between March 8 and August
30, 2020. They reported an 11% higher
risk of dying and a 13% higher risk of intensive care unit admission for each
1-μg/m3 increase PM2.5 and no association with
NO2 or BC (Bozack et al. 2022). Findings from our and previous studies on this topic provide
solid support for the idea that air pollution likely increases the severity of
the COVID-19 in COVID-19 patients. Notably, observed associations of air
pollution with the severity of COVID-19 in COVID-19 patients are weaker than
those for air pollution and risk of COVID-19 in the general population. This may
indicate that long-term exposure to air pollution, captured here by exposure in
2019, increases risk of contracting COVID-19, but is a weaker determinant of
COVID-19 prognosis in terms of risk of hospitalization and not a determinant of
survival from COVID-19 in COVID-19 patients. This may be so because long-term
exposure to air pollution based on mean pollution in 2019 does not capture
relevant air pollution exposure window, which may be more relevant for prognosis
of COVID-19 in the COVID- 19 patients’ risk of hospitalization or deaths
within weeks. This risk may be better captured by more short-term exposure
(months, weeks, days after COVID-19 infection), which may be more likely
relevant for the potential mechanism for air pollution impact on prognosis, via
compromised immunity responses. Another explanation is merely that other factors
play more important roles for COVID-19 prognosis than air pollution, such as
comorbidities, genetics, lifestyles, and access to treatment. Finally, another
plausible explanation is collider or selection bias in analyses of COVID-19
patients — a group selected on exposure of interest and outcomes (higher
air pollution exposure and more severe COVID-19 outcomes) — due to higher
prevalence of comorbidities, low SES, etc., which may bias results toward null
(Griffith et al. 2020). Griffith and
colleagues discuss intrinsic difficulties and inference of studies of COVID-19
determinants based on COVID-19 patients.
BIOLOGICAL PLAUSIBILITY
Although the exact molecular mechanisms by which exposure to PM and gaseous
pollutants affects viral infection and pathogenesis of COVID-19 remain unknown,
there are a number of plausible pathways that can account for this association
(Woodby et al. 2021). Apart from the
direct impact of air pollution on immune responses, air pollution also likely
increases risk of COVID-19 severity and death indirectly by increasing risk of
related comorbidities (respiratory, cardiovascular, and metabolic diseases)
which then increases risk of severe outcomes in COVID-19 patients. This may
explain very strong associations between air pollution and COVID-19, observed in
our study and others, as well as stronger associations with increasing severity
of COVID-19 outcomes. Notably, in this study we were able to examine long-term
exposure to air pollution assessed as the annual mean of pollutant concentration
in 2019 and the accumulated exposure over 3 and 10 years before 2020, and we
detected associations with all three exposure windows. This long-term exposure
is likely to reflect and favor the postulated mechanism that air pollution
increases risk of COVID-19 by increasing risk of comorbidities with
cardiometabolic and respiratory diseases. We did not have data of shorter or
more recent exposure windows, those of days, weeks, or months prior to
SARS-CoV-2 infection, which are likely to be most relevant for the mechanism of
the direct impact of air pollution on immune system and for the increased risk
of contracting infection due to air pollution–related compromised
immunity. Thus, we concluded that most likely our analyses and results give
support for the mechanisms of air pollution impact on COVID-19 incidence,
hospitalization, and mortality via an accumulated effect of air pollution over
many years and increased risk of a number of chronic diseases, which in turn
increase risk of COVID-19.
STRENGTHS
Our study is the largest to date and the first nationwide analyses of
associations between long-term exposure to air pollution and risk of COVID-19,
facilitated by the internationally unique access to high-quality
individual-level Danish COVID-19 surveillance data for an entire population.
Furthermore, as Denmark had one of the most intense testing strategies and
testing was offered free of charge, we were arguably, especially in the second
wave of pandemic, able to determine the most complete definition of incidence of
SARS-CoV-2, as more than 80% of the population was tested several times per
month in the first 14 months of the pandemic. Secondly, we benefited from
detailed data on disease history, which allowed us to study effect modification
by comorbidities, and from a number of SES factors and data at individual and
parish-level, population density, and household size, allowing for an extensive
adjustment for SES factors. In addition, we benefited from data on air pollution
exposure at the level of residences in 2019 and historically for 10 years prior
to the pandemic, which allowed us to examine the effect of different exposure
windows on COVID-19. We showed that detected associations of air pollution with
COVID-19 were strong, and robust to adjustment for a number of factors as well
as different air pollution assessment approaches, confirming that observed
associations are likely to be real. Furthermore, as the first study to date, we
benefited from data that allowed us to create monthly SARS-CoV-2 positivity
rates for each municipality, by which we could capture at least some of the
spatiotemporal development of the epidemic (Appendix Table A4). When
conducting time-varying analyses (by splitting follow-up time in months), we
found that accounting for epidemic development resulted in only a slight
attenuation of the effect estimates as compared with those from our main
modeling approach, the fixed-time Cox model. This result indicates that the
association of long-term exposure to air pollution with COVID-19 is not
confounded by the spatiotemporal patterns in pandemic development (Appendix Table A4).
LIMITATIONS
Our study has several limitations. First, we lack data on a number of possibly
relevant confounders. We lack data on individual-level lifestyle factors, such
as smoking, physical activity, BMI, diet, and alcohol use, which are related to
air pollution and risk of contracting COVID-19. Another major limitation in our
analyses is lack of data on patterns of access to COVID-19 testing, treatment,
prevention efforts (such as physical and social distancing), vaccination status,
mask recommendations and mask use, adherence to self-isolation, and viral spread
that might be associated with air pollution. We did show that adjustment for
municipality-level monthly COVID-19 positivity rates did not affect our main
estimates. Still, it is likely that our very strong estimates of association
between air pollution and COVID-19 incidence and mortality may be in part
explained by residual confounding by a number of these missing confounders.
Another limitation is the lack of data on residence in nursing homes, where a
number of countries experienced extreme high rates of COVID-19 infection and
mortality. We could not address this and could therefore not make sensitivity
analyses excluding nursing home residents. Notably, there was no record of
heightened mortality in nursing homes in Denmark as was seen elsewhere.
Furthermore, it is considered that Denmark is one of the countries that has
managed COVID-19 pandemic extremely well, without any excess mortality in 2020,
and without COVID-19 mortality clusters in nursing homes. Still, it is possible
that some of our high effect estimates may be explained by a strong association
between air pollution and COVID-19 in nursing homes.
The Danish COVID-19 surveillance system, especially in the early stages of the
pandemic, could only identify a selected sample of all infected individuals, for
example, those with severe symptoms, close contacts of primary cases with
symptoms, and those who were hospitalized for other causes, and were thus tested
routinely. The testing policy was massively expanded in the second wave, from
around August 2020 and onward, when testing free of charge was offered to all
Danish residents. This has resulted in a large portion of population being
tested daily, as a negative test result was required to enter workplaces,
universities, schools, restaurants, movie theaters, theaters, sport facilities,
and public transport. Therefore, our definition of SARS-CoV-2 incidence is only
partial, especially in the first wave. Consequently, the definition of COVID-19
in two phases of the pandemic differ substantially and thus, results on air
pollution association with COVID-19 cannot be directly compared in two waves. We
did show, however, that our results were unchanged when limiting the study
population to those who were tested, comprising 78% of total population (Appendix page 6),
suggesting that the selection of the population who was tested was not related
to air pollution exposure.
Challenges specific to studying COVID-19 incidence include accurate
identification of cases, as well as potential or differential errors in case
ascertainment for different population groups. Identification of incident cases
depends on a number of factors including voluntary participation in testing, the
testing capacity and accessibility, the cost of testing, test accuracy, symptom
severity and recognition in the case where testing is offered only to those with
certain symptoms or certain symptom severity (e.g., in the first wave of the
pandemic in our study and in many countries with more limited testing capacity
than Denmark). Furthermore, high rates of asymptomatic virus carriers, as well
as cases with atypical symptom presentation, both of which depend on COVID-19
variant and change over time, further complicate the accurate ascertainment of
COVID-19 incident cases. We must also acknowledge differential errors in
ascertainment for different population groups, by occupation, SES, ethnicity,
place of residence and social connectedness, frailty, internet access and
technological engagement, and medical and scientific interest. Certain
occupations, such as healthcare workers, are far more likely to be tested, and
will be overrepresented in incidence ascertainment. Similarly, frail people,
such as people who are older, obese, have major chronic diseases, or are nursing
home residents, as well as possibly smokers, are also tested more. People with
better access to healthcare and testing facilities, those with awareness and
access to information, skills to use internet apps used for booking testing or
checking results, as well as those with strong medical and scientific interest
will be more likely to be tested (Griffith et al. 2020). In any case, in this study, we must acknowledge
the limitation of defining COVID-19 hospitalization or death as any such event
that occurred within a period after first diagnosis, rather than an official
primary cause of that hospitalization or death. We must also acknowledge that
differential accuracy in ascertainment of COVID-19 cases and overrepresentation
of cases for certain subgroups may have influenced our effect modification
result.
We lacked data on vaccinations and could not address whether vaccination would
have affected observed associations. First vaccination in Denmark was given on
December 27, 2020, and only a fraction of population was vaccinated by April 26,
2021. At the end of follow-up in this study 555,236 people, or 9.5% of Danish
population, were fully vaccinated, and 1,226,180 people (21% of Danish
population) received first dose on April 26th, 2022 (Appendix Figure A8).
CONCLUSION
In a nationwide Danish study covering first 14 months of COVID-19 pandemic, we have
found that long-term exposure to air pollution at very low levels — levels
well below current EU limit values — is associated with increased risk of
contracting SARS-CoV-2, as well as developing severe COVID-19 disease demanding
hospitalization or resulting in death. Patients with chronic cardiometabolic,
respiratory, and neurodegenerative diseases, older people, those people with prior
acute lower respiratory infections, and people in the lowest SES groups are most
susceptible and most likely to contract SARS-CoV-2 or develop COVID-19 associated
with air pollution and need to be protected. These findings contribute important new
data to an increasing evidence base showing that air pollution is a risk factor for
COVID-19, adding to an overall burden of air pollution. The reduction of air
pollution should be at the heart of current and future pandemic mitigation
strategies, as it would provide more resilient populations to SARS-CoV-2 and similar
infections.
IMPLICATIONS OF THE FINDINGS
This large nationwide study provides strong new evidence in support of association
between long-term exposure to air pollution and COVID-19. These results reinforce
the importance of air pollution regulation as an integral part of COVID- 19 pandemic
mitigation strategies, as well as for planning for future similar pandemics.
Reduction of air pollution would provide for populations who are more resilient to
viral respiratory infections, such as COVID-19, and likely to other viral and
bacterial respiratory infections (e.g., seasonal influenza and pneumonias).
Reductions in air pollution would also bring other major health benefits, in terms
of prevention of major chronic noncommunicable diseases and providing for better
quality of life and better disease prognosis for patients with chronic diseases, as
well as in mitigating impact of climate change on health.
ACKNOWLEDGMENTS
This work has been supported by the Health Effects Institute (RFA 20-1B) and by the
Novo Nordisk Foundation Challenge Programme (NNF17OC0027812).
Footnotes
* A list of abbreviations and other terms appears at the end of this
volume.
HEI QUALITY ASSURANCE STATEMENT
Eastern Research Group, Inc. (ERG) independently provided quality assurance (QA)
oversight for this study. ERG staff members Dr. Clifton Dassuncao, John Wilhelmi,
and Dr. Rebecca Devries conducted a remote audit of the final report. An on-site
audit was not conducted for this study. The ERG auditors are experienced in QA
oversight and the subject matter relevant to this study, including epidemiological
methods, statistical methods, exposure assessment, air quality modeling, and health
outcomes research. Dr. Dassuncao, an environmental epidemiologist, served as the
lead auditor and interacted with principal investigators, reviewed R code, and
reviewed all aspects of the final report. Mr. Wilhelmi, an air quality specialist,
and Dr. Devries, an epidemiologist, provided additional independent reviews of the
final report.
The remote audit of the final report was conducted from April through November 2023.
The objectives of this audit were to ensure that study methods were well documented,
the final report was understandable, reported results were accurate, and key study
findings and limitations were highlighted. The audit also evaluated whether the
documented study protocols were adhered to. To meet these objectives, the ERG
auditors reviewed the final report text, tables, and figures to verify their
accuracy and clarity. Study and QA protocols were also reviewed for consistency with
reported methods. R codes documenting data processing and analysis were provided to
ERG and compared to the methods and findings described in the final report. However,
the researchers did not share with ERG the underlying air quality modeling data or
the data on COVID-19 testing, morbidity, and mortality. The researchers noted that
the COVID-19 data could not be shared due to confidentiality restrictions. Without
access to these data, ERG could not reproduce any results in the final report. ERG
was able to review some data processing code to verify that certain calculations
were conducted consistent with described methods.
ERG auditors focused their review on the final report text and how it adhered to
study protocols and documented analyses in R. Auditors identified parts of the final
report text that could be improved for clarity and accuracy. Some discrepancies were
identified between the report text, the R code, and study protocols; however, these
discrepancies were addressed and did not alter the findings or conclusions. Auditors
were unable to verify specific numerical values without access to the data to rerun
analyses; however, numerical values were evaluated for internal consistency and
against the R code.
Audit findings were documented in an ERG audit report and an HEI follow-up
memorandum. The findings of the audit did not critically impact the overall results
of this research study. Primary analyses were clearly documented in R, the overall
approach was adequately described, and key results were clearly presented in tables
and figures. Although ERG was not provided the data needed to reproduce results, the
audit team is confident that the final AIRCODEN study report was representative of
the research conducted and that the study followed a valid set of procedures
documented in study protocols.
Zorana Jovanovic Andersen is a professor from the Section of
Environmental Health, Department of Public Health, at the University of Copenhagen
in Denmark. Over the last 15 years, she has focused on studying health effects
related to exposure to air pollution and road traffic noise, which resulted in 112
published peer-reviewed papers (21 as first, 27 as second, and 26 as last author),
with a scientific impact factor of 47 (Google Scholar) and more than 9,400
citations. Andersen has documented adverse effects of air pollution in Denmark
showing that long-term exposure to air pollution leads to increased risk of asthma,
chronic obstructive pulmonary disease, cardiovascular disease, stroke, diabetes,
lung cancer, and premature mortality in adults as well as asthma in children. Her
main research findings are that — despite low levels of air pollution in
Denmark complying with EU limit values — there is still significant health
burden due to air pollution exposure. Her research has strengthened the evidence
base for stricter air pollution regulation in the European Union. Andersen’s
other contributions include results showing that benefits of exercise outweigh harms
related to air pollution exposure when exercising in highly polluted areas. She is
also active in work with advocacy and translation of knowledge on air pollution
health effects to policymakers through her role as Chair of the European Respiratory
Society Environmental Health Committee, member of the Expert Group on Air Pollution
in Copenhagen Municipality, member of the International Society for Environmental
Epidemiology (ISEE) Policy Committee, and ISEE representative at the International
Network for Epidemiology in Policy.
Jiawei Zhang is a Ph.D. fellow from the Section of Environmental Health,
Department of Public Health, at the University of Copenhagen in Denmark, under the
supervision of Zorana Jovanovic Andersen, Youn-Hee Lim, and Rudi G.J. Westendorp.
His doctoral project focused on the association between long-term exposure to air
pollution and risk of morbidity and mortality from respiratory disease with a
special concentration on infectious disease, including COVID-19, pneumonia, and
other lower respiratory tract infection diseases. Zhang has enrolled in several
HEI-funded projects, including the ELAPSE project and the Impact of Exposure to Air
Pollution on Asthma project. In the AIRCODEN project, he contributed to the cohort
generation and statistical analysis.
Youn-Hee Lim is an assistant professor from the Section of Environmental
Health, Department of Public Health, at the University of Copenhagen in Denmark. She
investigates associations between climate change, air pollution, and
endocrine-disrupting chemicals and growth and neurocognitive development in children
as well as cardiovascular, metabolic, and neurodegenerative diseases in women and
older populations. In addition, Lim is interested in the roles of the gene, DNA
methylation, and microbiome on environmental health.
Rina So is a postdoctoral fellow from the Section of Environmental
Health, Department of Public Health at the University of Copenhagen in Denmark. She
obtained her Ph.D. degree from the University of Copenhagen under the supervision of
Zorana Jovanovic Andersen. In her Ph.D. project, So studied the association of
long-term exposure to air pollution and road traffic noise with mortality and
morbidity in Denmark using the Danish Nurse Cohort and nationwide health
administrative registries.
Jeanette T. Jørgensen obtained her Ph.D. degree from the
Department of Public Health at the University of Copenhagen in Denmark under the
supervision of Zorana Jovanovic Andersen. She has experience in register-based
research from multiple Danish and international projects. Her cross-disciplinary
background with an M.Sc. IT and Health has given her solid and unique analytical
skills — appropriate in various parts of the research process from design and
statistical programming to the interpretation and dissemination of research results.
Jørgensen’s research is in the field of environmental and occupational
epidemiology, and her work has resulted in authorships of 18 scientific papers
published in various international peer-reviewed journals.
Laust H. Mortensen is the head of the data science lab at Statistics
Denmark and a professor of epidemiology at the University of Copenhagen in Denmark.
He conducts research in social and perinatal epidemiology and teaches epidemiology
in a number of programs (medicine, public health, M.P.H., and Ph.D.), supervising
students in Ph.D. courses and in bachelor’s and thesis projects.
Mortensen’s areas of supervision range from epidemiological analyses based on
the Danish DanCHASE register (which consists of all pregnancies from approximately
1980 onward) to systematic reviews and meta-analyses of all types of studies.
George M. Napolitano is an academic research staff member and
statistician from the Section of Environmental Health, Department of Public Health,
at the University of Copenhagen in Denmark. He contributes his statistical expertise
to a number of epidemiological studies on various questions related to cervical
cancer (the impact of HPV vaccination, management of cervical lesions; the risk of
precancerous lesions related to the use of contraceptives) and to breast cancer
(mammography density as a risk factor; the impact of the Danish mammography
screening program on breast cancer mortality). He is involved in the study and
development of the so-called allostatic load score, a summary
measure of multisystem dysregulation defined by biomarkers from different organ
systems, as an aggregate indicator of health at individual and community levels. His
theoretical research in mathematical physics focused on probabilistic properties of
random graphs, their interaction with statistical mechanical models, and their
application as modeling tools.
Thomas Cole-Hunter is an assistant professor from the Section of
Environmental Health, Department of Public Health, at the University of Copenhagen
in Denmark. He has broad experience in environmental health (epidemiology) and
exposure assessment for air pollution and noise, including emissions from
cookstoves, road traffic, and waste-to-energy incinerators. He studies the clinical
and subclinical health effects of exposure among general and susceptible
populations, from active commuters (walkers and bicyclists) in urban developments to
cookstove users in regional or rural settings. He gained expertise in this area by
working with large European Commission–funded projects as well with smaller
(U.S.) National Institutes of Health–funded studies — while supported
by an (Australian) National Health and Medical Research Council fellowship.
Cole-Hunter obtained his Ph.D. in 2013 at the International Laboratory for Air
Quality and Health (ILAQH), a World Health Organization Collaborative Center, under
the supervision of ILAQH Professor and Director Lidia Morawska.
Steffen Loft is a professor from the Section of Environmental Health,
Department of Public Health, at the University of Copenhagen in Denmark. He
researches toxicology and how the body absorbs and handles toxins. In particular, he
studies the effect of particles in air pollution and is knowledgeable about the
relationship between diet and cancer as well as the negative health aspects of
modern industrial nanotechnology. His major recent research achievements include
demonstration of effects of nanoparticles on oxidative damage to DNA and vascular
functions, both in susceptible transgenic animal models and in humans, and that a
number of biomarkers of exposure can predict risk of cancer in prospective settings.
Loft has published over 400 scientific papers in international peer-reviewed
journals in the field of toxicology.
Samir Bhatt is a professor of machine learning and public health at the
University of Copenhagen in Denmark and a professor of statistics and public health
at the Imperial College London in the United Kingdom. His group focuses on
mathematical, statistical, and computer science tools to answer questions about
human health. Bhatt has a special interest in developing machine learning and
statistical tools applied to public health questions, infectious disease modeling,
malaria, gaussian and branching processes, and healthcare trajectories.
Gerard Hoek is an associate professor at the Institute for Risk
Assessment Sciences at Utrecht University in the Netherlands. He has more than 20
years of experience in performing research in air pollution exposure assessment and
epidemiology. His main research has been exposure assessment and epidemiological
studies of respiratory and cardiovascular effects of short- and long-term exposure
to fine and ultrafine particles. Hoek graduated in 1986 as an environmental
hygienist, and in 1992 he obtained his Ph.D. degree in air pollution epidemiology
(short-term respiratory health effects of outdoor air pollution in children). He has
been principal investigator and senior scientist in a large number of
E.U.–funded studies in the field of environmental health, and he has advised
the U.S. Environmental Protection Agency (EPA), the European Union, the World Health
Organization, the Health Effects Institute, and other national and international
bodies. He coordinated exposure assessment and the cardiorespiratory mortality
effects of outdoor air pollution in the multicenter ESCAPE study. In addition, Hoek
has served as a reviewer for major biomedical and epidemiological journals and is
the coauthor of more than 250 peer-reviewed papers in the fields of environmental
exposure assessment and epidemiology. His recent research interests include health
effects of combined exposure to air pollution, noise, and greenness as well as the
development of models using mobile monitoring.
Bert Brunekreef is an emeritus professor of environmental epidemiology
in veterinary medicine and medicine at Utrecht University in the Netherlands. On
several occasions, he served as advisor on national and international panels in the
field of environmental health, including the Dutch National Health Council (of which
he is a member), the World Health Organization, and the U.S. EPA. Brunekreef is a
coauthor of more than 400 peer-reviewed journal articles in the field of
environmental epidemiology and exposure assessment. In recent years, he received the
ISEE John Goldsmith award (2007), the European Lung Foundation Award (2007), an
honorary doctorate of the Catholic University of Leuven, Belgium (2008), the
Heineken Prize for Environmental Sciences (2008), and an Academy Professorship of
the Dutch Royal Academy of Sciences (2009), to which he also was elected to become a
member in 2009.
Rudi G.J. Westendorp is a professor of medicine of old age in the
Department of Public Health at the University of Copenhagen in Denmark. He is also a
codirector of the Center of Healthy Aging at the University of Copenhagen and senior
scientist at Statistics Denmark. Westendorp has coauthored over 700 peer-reviewed
reports that have been cited over 25,000 times. His Hirsch-index is 75+.
Using analysis from Web of Science in 2012, Lab Times ranked him as
the eighth most cited author in aging research in Europe, which includes the second
most cited article from 1999 through 2010.
Matthias Ketzel is a professor in the Section of Atmospheric Modelling,
Department of Environmental Science, at Aarhus University in Roskilde, Denmark, and
a visiting professor at the Global Centre for Clean Air Research (GCARE) at the
University of Surrey in the United Kingdom. He received his Ph.D. from Lund
University in Sweden. He has a background in physics and fluid dynamics and has more
than 28 years of experience in the field of atmospheric science, specifically human
exposure assessment and local-scale atmospheric dispersion modeling. Ketzel’s
main research interest is aerosol dynamics modeling and human exposure estimation at
regional, urban, and street scale with a strong focus on particles and gaseous air
pollutants.
Jørgen Brandt is a professor and head of the section of
atmospheric modeling and the Centre Director of iCLIMATE in the Department of
Environmental Science at Aarhus University. He has an M.Sc. in geophysics and
meteorology and a Ph.D. in atmospheric physics/atmospheric modelling from the Niels
Bohr Institute at the University of Copenhagen in Denmark. He has 27 years of
experience in calculating air pollution levels with very high resolution over a long
period for the hemispheric, regional, national, and urban background scales. He has
been leading the development of an integrated multiscale model system (THOR),
including all scales from the Northern Hemisphere, European scales, national scales,
urban background, and street canyon. Results from THOR have already been applied
with success in epidemiological research.
Theis Lange is the vice head of the Department of Public Health at the
University of Copenhagen in Denmark. His research involves theoretical research
within statistics as well as a wide range of applied collaborations with medical
doctors, epidemiologists, and psychologists. His theoretical work is focused on
causal inference (i.e., a formal framework for addressing cause and effect methods
he has developed), which has been broadly applied and whose novelty was recognized
by the 2012 Kenneth Rothman Prize (the underlying paper has been cited 190 times).
His applied collaborations span from randomized controlled trials to complex
longitudinal observational studies and from intensive care research to psychology;
in total, he has published 142 papers (total number of citations 3,084; h-index 30).
Since being awarded the EliteForsk travel grant of 250,000 DKK during his Ph.D.,
Lange has been principal investigator and co-principal investigator for successful
grant applications totaling 120 million DKK. Until the summer of 2019, he held a
dual position in the Section of Biostatistics at the University of Copenhagen and
the Center for Statistical Science at Peking University. Lange has served on the
Danish Heart Association and Statistics Denmark research boards and has been working
for BeiGene as their senior statistical methodology expert (BeiGene is a Chinese
pharmaceutical company working on novel oncology treatments).
Thea Kølsen-Fisher is a medical doctor with a D.M.Sc. (Ph.D.) in
virology and infectious disease epidemiology and a medical specialization in public
health. She has a clinical background in infectious diseases, was trained in
epidemic response and preparedness at the U.S. Centers for Disease Control and
Prevention, and has conducted worldwide research in the interdisciplinary field of
virus epidemics and prevention for over 20 years. Kølsen-Fisher currently
serves as an adjunct professor at the University of Southern Denmark in Global
Health and Infectious Diseases. In 2019, she was invited to write reviews for
Emerging Infectious Diseases, The New England Journal of Medicine, The
Lancet Infectious Diseases, and Eurosurveillance.
OTHER PUBLICATIONS RESULTING FROM THIS RESEARCH
Zhang J, Lim Y-H, So R, Jørgensen JT, Mortensen LH, Napolitano GM, et al.
2023. Long-term exposure to air pollution and SARS-CoV-2 infection and COVID-19
hospitalisation or death: Danish nationwide cohort study. Eur Respir J 62:2300280;
doi:10.1183/13993003.00280-2023.
REFERENCES
Atkins JL, Masoli JAH, Delgado J, Pilling LC, Kuo CL, Kuchel GA, et al. 2020. Preexisting
comorbidities predicting COVID- 19 and mortality in the UK Biobank Community
Cohort. J Gerontol A Biol Sci Med Sci
75:2224–2230;
doi:10.1093/ gerona/glaa183.
[DOI] [PMC free article] [PubMed] [Google Scholar]
Baadsgaard M, Quitzau J. 2011. Danish registers
on personal income and transfer payments. Scand J
Public Health
39:103–105;
doi:10.1177/1403494811405098.
[DOI] [PubMed] [Google Scholar]
Boogaard H, Patton AP, Atkinson RW, Brook JR, Chang HH, Crouse DL, et al. 2022. Long-term
exposure to traffic-related air pollution and selected health outcomes: A
systematic review and meta-analysis. Environ
Int
164:107262; doi:10.1016/j.
envint.2022.107262.
[DOI] [PubMed] [Google Scholar]
Bowe B, Xie Y, Gibson AK, Cai M, van Donkelaar A, Martin RV, et al. 2021. Ambient
fine particulate matter air pollution and the risk of hospitalization among
COVID-19 positive individuals: Cohort study. Environ
Int
154:106564; doi:10.1016/j.
envint.2021.106564.
[DOI] [PMC free article] [PubMed] [Google Scholar]
Bowe B, Xie Y, Yan Y, Al-Aly Z. 2019. Burden of
cause-specific mortality associated with PM2.5 air pollution in
the United States. JAMA Netw Open
2:e1915834; doi:10.1001/
jamanetworkopen.2019.15834.
[DOI] [PMC free article] [PubMed] [Google Scholar]
Bozack A, Pierre S, DeFelice N, Colicino E, Jack D, Chillrud SN, et al. 2022. Long-term
air pollution exposure and COVID-19 mortality: A patient-level analysis from
New York City. Am J Respir Crit Care Med
205:651–662;
doi:10.1164/ RCCM.202104-0845OC.
[DOI] [PMC free article] [PubMed] [Google Scholar]
Brandt J, Christensen JH, Frohn LM, Berkowicz R, Brandt J, Christensen JH, et al. 2003. Air
pollution forecasting from regional to urban street scale implementation and
validation for two cities in Denmark. Phys Chem
Earth
28:335–344;
doi:10.1016/S1474-7065(03)00054-8. [Google Scholar]
Brandt J, Silver JD, Frohn LM, Geels C, Gross A, Hansen AB, et al. 2012. An
integrated model study for Europe and North America using the Danish
Eulerian Hemispheric Model with focus on intercontinental transport of air
pollution. Atmos Environ
53:156–176;
doi:10.1016/J.ATMOSENV.2012.01.011. [Google Scholar]
Brauer M, Brook JR, Christidis T, Chu Y, Crouse DL, Erickson A, et al. 2019.
Mortality-Air Pollution Associations in Low-Exposure
Environments (MAPLE): Phase 1. Research Report
203. Boston,
MA:Health Effects
Institute;
1–87. [PMC free article] [PubMed] [Google Scholar]
Carey IM, Anderson HR, Atkinson RW, Beevers S, Cook DG, Dajnak D, et al. 2016. Traffic
pollution and the incidence of cardiorespiratory outcomes in an adult cohort
in London. Occup Environ Med
73:849–856;
doi:10.1136/OEMED-2015-103531.
[DOI] [PMC free article] [PubMed] [Google Scholar]
Carey IM, Atkinson RW, Kent AJ, van Staa T, Cook DG, Anderson HR. 2013. Mortality
associations with long-term exposure to outdoor air pollution in a national
English cohort. Am J Respir Crit Care Med
187:1226–1233;
doi:10.1164/ RCCM.201210-1758OC.
[DOI] [PMC free article] [PubMed] [Google Scholar]
Chen C, Wang J, Kwong J, Kim JH, van Donkelaar A, Martin RV, et al. 2022. Association
between long-term exposure to ambient air pollution and COVID-19 severity: A
prospective cohort study. CMAJ
194:E693–E700;
doi:10.1503/cmaj.220068.
[DOI] [PMC free article] [PubMed] [Google Scholar]
Chen J, Hoek G. 2020. Long-term exposure
to PM and all cause and cause-specific mortality: A systematic review and
meta-analysis. Environ Int
143:105974; doi:10.1016/j.
envint.2020.105974.
[DOI] [PubMed] [Google Scholar]
Danesh Yazdi M, Wang Y, Di Q, Wei Y, Requia WJ, Shi L, et al. 2021. Long-term
association of air pollution and hospital admissions among Medicare
participants using a doubly robust additive model.
Circulation
143:1584–1596;
doi:10.1161/CIRCULATIONAHA.120.050252.
[DOI] [PMC free article] [PubMed] [Google Scholar]
de Hoogh K, Chen J, Gulliver J, Hoffmann B, Hertel O, Ketzel M, et al. 2018. Spatial
PM2.5, NO2, O3 and BC models for
Western Europe: Evaluation of spatiotemporal stability.
Environ Int
120:81–92;
doi:10.1016/J.ENVINT.2018.07.036.
[DOI] [PubMed] [Google Scholar]
de Hoogh K, Gulliver J, van Donkelaar A, Martin RV, Marshall JD, Bechle MJ, et al. 2016. Development
of West-European PM2.5 and NO2 land use regression
models incorporating satellite-derived and chemical transport modelling
data. Environ Res
151:1–10;
doi:10.1016/J.ENVRES.2016.07.005.
[DOI] [PubMed] [Google Scholar]
Di Q, Wang Y, Zanobetti A, Wang Y, Koutrakis P, Choirat C, et al. 2017. Air
pollution and mortality in the Medicare population.
N Engl J Med
376:2513–2522;
doi:10.1056/NEJ-Moa1702747.
[DOI] [PMC free article] [PubMed] [Google Scholar]
Elliott J, Bodinier B, Whitaker M, Delpierre C, Vermeulen R, Tzoulaki I, et al. 2021. COVID-19
mortality in the UK Biobank cohort: Revisiting and evaluating risk
factors. Eur J Epidemiol
36:299–309;
doi:10.1007/S10654-021-00722-Y.
[DOI] [PMC free article] [PubMed] [Google Scholar]
Griffith GJ, Morris TT, Tudball MJ, Herbert A, Mancano G, Pike L, et al. 2020. Collider bias
undermines our understanding of COVID-19 disease risk and
severity. Nat Commun
12:5749;
doi:10.1038/s41467-020-19478-2. [DOI] [PMC free article] [PubMed] [Google Scholar]
Health Effects Institute.
2020. State of Global Air 2020. Special
Report. Boston,
MA:Health Effects
Institute. [Google Scholar]
Heederik DJJ, Smit LAM, Vermeulen RCH. 2020. Go slow to go
fast: A plea for sustained scientific rigour in air pollution research
during the COVID-19 pandemic. Eur Respir J
56:2001361;
doi:10.1183/13993003.01361-2020.
[DOI] [PMC free article] [PubMed] [Google Scholar]
Hvidtfeldt UA, Ketzel M, Sørensen M, Hertel O, Khan J, Brandt J, et al. 2018. Evaluation
of the Danish AirGIS air pollution modeling system against measured
concentrations of PM2.5, PM10, and black
carbon. Environ Epidemiol
2:1; doi:10.1097/
EE9.0000000000000014. [Google Scholar]
Jensen VM, Rasmussen AW. 2011. Danish education
registers. Scand J Public Health
39:91–94;
doi:10.1177/1403494810394715.
[DOI] [PubMed] [Google Scholar]
Jerrett M. 2022. Air pollution as a
risk for death from infectious respiratory disease.
Am J Respir Crit Care Med 205:1374–
1375;
doi:10.1164/RCCM.202202-0351ED. [DOI] [PMC free article] [PubMed] [Google Scholar]
Katanoda K, Sobue T, Satoh H, Tajima K, Suzuki T, Nakatsuka H, et al. 2011. An
association between long-term exposure to ambient air pollution and
mortality from lung cancer and respiratory diseases in
Japan. J Epidemiol
21:132–143;
doi:10.2188/JEA.JE20100098.
[DOI] [PMC free article] [PubMed] [Google Scholar]
Kazemiparkouhi F, Eum K-D, Wang B, Manjourides J, Suh HH. 2020. Long-term ozone
exposures and cause-specific mortality in a U.S. Medicare
cohort. J Expo Sci Environ Epidemiol
30:650–658;
doi:10.1038/S41370-019-0135-4.
[DOI] [PMC free article] [PubMed] [Google Scholar]
Khan J, Kakosimos K, Raaschou-Nielsen O, Brandt J, Jensen SS, Ellermann T, et al. 2019. Development
and performance evaluation of new AirGIS: A GIS based air pollution and
human exposure modelling system. Atmos Environ
198:102–
121;
doi:10.1016/j.atmosenv.2018.10.036. [Google Scholar]
Kogevinas M, Castaño-Vinyals G, Karachaliou M, Espinosa A, de Cid R, Garcia-Aymerich J, et al. 2021. Ambient air
pollution in relation to SARS-CoV-2 infection, antibody response, and
COVID-19 disease: A cohort study in Catalonia, Spain (COVICAT
Study). Environ Health Perspect
129:117003;
doi:10.1289/EHP9726.
[DOI] [PMC free article] [PubMed] [Google Scholar]
Konstantinoudis G, Padellini T, Bennett J, Davies B, Ezzati M, Blangiardo M. 2021. Long-term exposure
to air-pollution and COVID-19 mortality in England: A hierarchical spatial
analysis. Environ Int
146:106316; doi:10.1016/J.
ENVINT.2020.106316.
[DOI] [PMC free article] [PubMed] [Google Scholar]
Liang D, Shi L, Zhao J, Liu P, Schwartz J, Gao S, et al. 2020. Urban air
pollution may enhance COVID-19 case-fatality and mortality rates in the
United States. medRxiv
2020.05.04.20090746;
doi:10.1101/2020.05.04.20090746. [DOI] [PMC free article] [PubMed] [Google Scholar]
Lim CC, Hayes RB, Ahn J, Shao Y, Silverman DT, Jones RR, et al. 2019. Long-term
exposure to ozone and cause-specific mortality risk in the United
States. Am J Respir Crit Care Med
200:1022–1031;
doi:10.1164/RCCM.201806-1161OC.
[DOI] [PMC free article] [PubMed] [Google Scholar]
Lin DY, Ying Z. 1994. Semiparametric
analysis of the additive risk model.
Biometrika
81:61;
doi:10.2307/2337050. [Google Scholar]
Liu S, Lim YH, Chen J, Strak M, Wolf K, Weinmayr G, et al. 2022. Long-term
air pollution exposure and pneumonia-related mortality in a large pooled
European Cohort. Am J Respir Crit Care Med
205:1429–1439;
doi:10.1164/rccm.202106-1484OC.
[DOI] [PubMed] [Google Scholar]
Mendy A, Wu X, Keller JL, Fassler CS, Apewokin S, Mersha TB, et al. 2021. Air
pollution and the pandemic: Long-term PM2.5 exposure and disease
severity in COVID-19 patients. Respirology
26:1181–1187;
doi:10.1111/RESP.14140.
[DOI] [PMC free article] [PubMed] [Google Scholar]
Neupane B, Jerrett M, Burnett RT, Marrie T, Arain A, Loeb M. 2010. Long-term exposure
to ambient air pollution and risk of hospitalization with community-acquired
pneumonia in older adults. Am J Respir Crit Care
Med
181:47–53;
doi:10.1164/rccm.200901-0160OC.
[DOI] [PubMed] [Google Scholar]
Nobile F, Michelozzi P, Ancona C, Cappai G, Cesaroni G, Davoli M, et al. 2022. Air
pollution, SARS-CoV-2 incidence, and COVID-19 mortality in Rome: A
longitudinal study. Eur Respir J
60:2200589;
doi:10.1183/13993003.00589-2022.
[DOI] [PMC free article] [PubMed] [Google Scholar]
Petersson F, Baadsgaard M, Thygesen LC. 2011. Danish registers
on personal labour market affiliation. Scand J
Public Health
39:95–98;
doi:10.1177/1403494811408483.
[DOI] [PubMed] [Google Scholar]
Pinault LL, Weichenthal S, Crouse DL, Brauer M, Erickson A, van Donkelaar A, et al. 2017.
Associations between fine particulate matter and mortality in
the 2001 Canadian Census Health and Environment Cohort.
Environ Res
159:406–415;
doi:10.1016/J.ENVRES.2017.08.037.
[DOI] [PubMed] [Google Scholar]
Pope CA, 3rd, Burnett RT, Thurston GD, Thun MJ, Calle EE, Krewski D, et al. 2004.
Cardiovascular mortality and long-term exposure to
particulate air pollution: Epidemiological evidence of general
pathophysiological pathways of disease.
Circulation
109:71–77;
doi:10.1161/01. CIR.0000108927.80044.7F.
[DOI] [PubMed] [Google Scholar]
Pope CA, 3rd, Lefler JS, Ezzati M, Higbee JD, Marshall JD, Kim SY, et al. 2019. Mortality
risk and fine particulate air pollution in a large, representative cohort of
U.S. adults. Environ Health Perspect
127:77007;
doi:10.1289/EHP4438.
[DOI] [PMC free article] [PubMed] [Google Scholar]
Raaschou-Nielsen O, Thorsteinson E, Antonsen S, Holst GJ, Sigsgaard T, Geels C, et al. 2020. Long-term
exposure to air pollution and mortality in the Danish population a
nationwide study. EClinicalMedicine
28:100605; doi:10.1016/J.
ECLINM.2020.100605.
[DOI] [PMC free article] [PubMed] [Google Scholar]
Salimi F, Morgan G, Rolfe M, Samoli E, Cowie CT, Hanigan I, et al. 2018. Long-term
exposure to low concentrations of air pollutants and hospitalisation for
respiratory diseases: A prospective cohort study in
Australia. Environ Int
121:415–420;
doi:10.1016/J.ENVINT.2018.08.050.
[DOI] [PubMed] [Google Scholar]
Schmidt M, Pedersen L, Sørensen HT. 2014. The Danish Civil
Registration System as a tool in epidemiology. Eur J
Epidemiol
29:541–9;
doi:10.1007/s10654-014-9930-3.
[DOI] [PubMed] [Google Scholar]
Schmidt M, Schmidt SAJ, Sandegaard JL, Ehrenstein V, Pedersen L, Sørensen HT. 2015. The Danish
National Patient Registry: A review of content, data quality, and research
potential. Clin Epidemiol
7:449–90;
doi:10.2147/CLEP.S91125.
[DOI] [PMC free article] [PubMed] [Google Scholar]
Sheridan C, Klompmaker J, Cummins S, James P, Fecht D, Roscoe C. 2022. Associations of
air pollution with COVID- 19 positivity, hospitalisations, and mortality:
Observational evidence from UK Biobank. Environ
Pollut
308:119686;
doi:10.1016/J.ENVPOL.2022.119686.
[DOI] [PMC free article] [PubMed] [Google Scholar]
Shin HH, Cakmak S, Brion O, Villeneuve P, Turner MC, Goldberg MS, et al. 2014. Indirect
adjustment for multiple missing variables applicable to environmental
epidemiology. Environ Res
134:482–487;
doi:10.1016/J.ENVRES.2014.05.016.
[DOI] [PubMed] [Google Scholar]
So R, Andersen ZJ, Chen J, Stafoggia M, de Hoogh K, Katsouyanni K, et al. 2022. Long-term
exposure to air pollution and mortality in a Danish nationwide
administrative cohort study: Beyond mortality from cardiopulmonary disease
and lung cancer. Environ Int
164:107241; doi:10.1016/J.
ENVINT.2022.107241.
[DOI] [PubMed] [Google Scholar]
Stafoggia M, Oftedal B, Chen J, Rodopoulou S, Renzi M, Atkinson RW, et al. 2022. Long-term
exposure to low ambient air pollution concentrations and mortality among 28
million people: Results from seven large European cohorts within the ELAPSE
project. Lancet Planet Health
6:e9–e18;
doi:10.1016/ S2542-5196(21)00277-1.
[DOI] [PubMed] [Google Scholar]
Strak M, Weinmayr G, Rodopoulou S, Chen J, de Hoogh K, Andersen ZJ, et al. 2021. Long-term
exposure to low level air pollution and mortality in eight European cohorts
within the ELAPSE project: Pooled analysis.
BMJ
374:n1904;
doi:10.1136/BMJ.N1904.
[DOI] [PMC free article] [PubMed] [Google Scholar]
Travaglio M, Yu Y, Popovic R, Selley L, Leal NS, Martins LM. 2021. Links between air
pollution and COVID-19 in England. Environ
Pollut
268(Pt A)115859;
doi:10.1016/J. ENVPOL.2020.115859.
[DOI] [PMC free article] [PubMed] [Google Scholar]
Turner MC, Jerrett M, Pope CA, Krewski D, Gapstur SM, Diver WR, et al. 2016. Long-term
ozone exposure and mortality in a large prospective study.
Am J Respir Crit Care Med 193:1134–
1142;
doi:10.1164/RCCM.201508-1633OC. [DOI] [PMC free article] [PubMed] [Google Scholar]
Veronesi G, de Matteis S, Calori G, Pepe N, Ferrario MM. 2022. Long-term exposure
to air pollution and COVID-19 incidence: A prospective study of residents in
the city of Varese, Northern Italy. Occup Environ
Med
79:192–199;
doi:10.1136/ OEMED-2021-107833.
[DOI] [PubMed] [Google Scholar]
Villeneuve PJ, Goldberg MS. 2020. Methodological
considerations for epidemiological studies of air pollution and the SARS and
COVID-19 coronavirus outbreaks. Environ Health
Perspect
128:095001;
doi:10.1289/EHP7411.
[DOI] [PMC free article] [PubMed] [Google Scholar]
Williamson EJ, Walker AJ, Bhaskaran K, Bacon S, Bates C, Morton CE, et al. 2020. Factors
associated with COVID-19- related death using OpenSAFELY.
Nature
584:430–436;
doi:10.1038/S41586-020-2521-4.
[DOI] [PMC free article] [PubMed] [Google Scholar]
Woodby B, Arnold MM, Valacchi G. 2021. SARS-CoV-2
infection, COVID-19 pathogenesis, and exposure to air pollution: What is the
connection?
Ann N Y Acad Sci
1486:15–38;
doi:10.1111/NYAS.14512.
[DOI] [PMC free article] [PubMed] [Google Scholar]
Wu X, Nethery RC, Sabath BM, Braun D, Dominici F. 2020. Exposure to air
pollution and COVID-19 mortality in the United States: A nationwide
cross-sectional study. medRxiv
2020.04.05.20054502;
doi:10.1101/2020.04.05.20054502. [Google Scholar]
Yang Y, Tang R, Qiu H, Lai PC, Wong P, Thach TQ, et al. 2018. Long term
exposure to air pollution and mortality in an elderly cohort in Hong
Kong. Environ Int
117:99–106;
doi:10.1016/J.ENVINT.2018.04.034.
[DOI] [PubMed] [Google Scholar]
Yorifuji T, Kashima S, Tsuda T, Ishikawa-Takata K, Ohta T, Tsuruta KI, et al. 2013. Long-term
exposure to traffic-related air pollution and the risk of death from
hemorrhagic stroke and lung cancer in Shizuoka, Japan.
Sci Total Environ
443:397–402;
doi:10.1016/J.SCITOTENV.2012.10.088.
[DOI] [PubMed] [Google Scholar]
Res Rep Health Eff Inst. 2023 Nov 1;2023:214.
Commentary by Review Committee
Research Report 214, Long-Term Exposure to AIR Pollution and COVID-19
Mortality and Morbidity in DENmark: Who Is Most Susceptible?
(AIRCODEN), Z.J. Andersen et al.
Dr. Zorana J. Andersen’s 1-year study, “Long-Term Exposure to
AIR Pollution and COVID-19 Mortality and Morbidity in DENmark: Who Is Most
Susceptible? (AIRCODEN),” began in March 2021. Total expenditures
were $224,036. The draft Investigators’ Report from Andersen
and colleagues was received for review in November 2022. A revised report,
received in April 2023, was accepted for publication in April 2023. During
the review process, the HEI Review Committee and the investigators had the
opportunity to exchange comments and clarify issues in both the
Investigators’ Report and the Review Committee’s
Commentary.
This document has not been reviewed by public or private party institutions,
including those that support the Health Effects Institute; therefore, it may
not reflect the views of these parties, and no endorsements by them should
be inferred.
The coronavirus (COVID-19*) pandemic
created unprecedented conditions that lent themselves to timely and novel air
pollution research aimed at exploring key policy-relevant questions. As described in
the Preface to this report, HEI issued Request for Applications 20-1B: Air
Pollution, COVID- 19, and Human Health. This RFA solicited applications for research
on novel and important aspects of the intersection of exposure to air pollution and
COVID-19 health outcomes. Specifically, HEI was interested in accountability studies
that considered the effects of the unprecedented interventions taken to control the
pandemic on emissions, air pollution, and human health, and in studies that
considered whether populations who had been exposed to higher levels of air
pollution were at greater risk of mortality from COVID-19 compared with others.
In response to the RFA, Dr. Zorana J. Andersen of the University of Copenhagen
submitted an application to HEI titled “Long-Term Exposure to AIR Pollution
and COVID-19 Mortality and Morbidity in DENmark: Who Is Most Susceptible?
(AIRCODEN).” Dr. Andersen proposed to use a population-based nationwide
cohort of Danish adults to investigate whether long-term exposure to air pollution
is associated with increased risk of COVID-19–related morbidity and mortality
and to identify the most susceptible groups by age, sex, socioeconomic status (SES),
ethnicity, and comorbidities. HEI’s Research Committee recommended funding
Dr. Andersen’s proposed study because it thought it had several strong
features, particularly the national population-wide cohort with individual-level
data and fine-resolution exposure data. This Commentary provides the HEI Review
Committee’s independent evaluation of the study. It is intended to aid the
sponsors of HEI and the public by highlighting both the strengths and limitations of
the study and by placing the results presented in the Investigators’ Report
into a broader scientific and regulatory context.
SCIENTIFIC BACKGROUND
Research from toxicology, human clinical studies, and epidemiology have linked air
pollution exposure with risk of acute lower respiratory infections (i.e.,
bronchitis, bronchiolitis, and pneumonia), influenza, and respiratory syncytial
virus (Monoson et al. 2023; Thurston et al.
2017). Research on such respiratory
infections is complicated, however, and has had mixed results regarding the role of
air pollution (HEI 2022; Loaiza-Ceballos et
al. 2022).
Some early studies on air pollution and COVID-19 suggested potential associations
(Bashir et al. 2020; Travaglio et al. 2021; Wu et al. 2020; Yao et al. 2020), but their ability to identify people who were infected or
seriously ill with COVID-19 was so fraught with errors (which had very high
potential to be correlated with air pollution) that the potential for biased results
was very high. These early studies also missed important confounders, and results
were difficult to compare and generalize due to different study designs, approaches
to exposure estimation (i.e., short-term vs. long-term exposures), and outcome
definitions (e.g., disease incidence, prevalence, severity, or case fatality rates).
Moreover, nearly all of the first studies published on this topic were based on
cross-sectional analyses or ecological study designs (including those mentioned
above and Coker et al. 2020; Cole et al.
2020; Konstantinoudis et al. 2021; Liang et al. 2020) that compared area-based estimates of pollution (e.g.,
averaged across counties or postal codes areas) with area-based rates of disease
incidence or mortality, for which individual-level risks cannot be derived.
Three early reviews (Copat et al. 2020;
Katoto et al. 2021; Villeneuve and Goldberg
2020) all concluded that although the
early body of evidence indicated that both short-term and long-term exposure to air
pollution could affect COVID-19 outcomes, all studies to date had moderate to high
overall risks of bias that precluded them from providing any insight into potential
causal associations.
At the time that Dr. Andersen’s study began, the available literature
therefore included little high-quality evidence. Given the many design limitations
of the previous studies on this topic, it was important to conduct the Andersen
study, which aimed to overcome many of them.
SUMMARY OF APPROACH AND METHODS
STUDY OBJECTIVES
The overarching goals of Dr. Andersen’s study were to investigate whether
long-term exposure to air pollution is associated with increased risk of
COVID-19–related mortality and morbidity and to identify the most
susceptible subgroups of the population. Specifically, the investigators
proposed the following aims:
Examine whether long-term exposures to fine particulate matter
<2.5 μg/m3 in diameter (PM2.5),
particulate matter <10 μg/m3 in diameter
(PM10), black carbon (BC), nitrogen dioxide
(NO2), and ozone (O3) are associated with risk
of COVID-19 incidence, hospitalizations, or deaths in the general
population.
Identify groups that are susceptible to air pollution–related
COVID-19 outcomes by age, sex, SES, ethnicity, and comorbidity with
several cardiometabolic and respiratory diseases and dementia.
Examine whether long-term exposures to PM2.5, PM10,
BC, NO2, and O3 are associated with poorer
prognosis in people who tested positive for COVID-19, in terms of higher
risk of hospitalization and mortality.
Briefly, the investigators used national registers to create a cohort of all
adults residing in Denmark on March 1, 2020, and at least 1 year prior to that.
The cohort of 3.7 million people included detailed individual and
community-level demographic and socioeconomic information. They assigned annual
estimates of PM2.5, PM10, BC2, NO3,
and O3 based on the year 2019 to each participant’s
residential address using chemical transport models. They used Cox proportional
hazard models to estimate associations between each pollutant and COVID-19
incidence, hospitalization, mortality, and death from any cause until April 26,
2021, adjusting for many individual and community-level characteristics.
The investigators conducted many additional analyses, including testing for
effect modification of any associations according to age, sex, SES, and
comorbidities. They examined the shapes of exposure–response functions,
results from two-pollutant models, and whether associations between the
pollutants and these outcomes differed during two separate waves of the
pandemic. The investigators used similar statistical approaches to those in the
main analyses to examine associations between pollutants and COVID-19
hospitalization and death in a subgroup of individuals who had tested positive
for COVID-19. The datasets and statistical approaches used in these analyses are
described in greater detail in the following sections.
METHODS AND STUDY DESIGN
Study Population
Andersen and colleagues created a national cohort of all Danish residents who
were 30 years of age or older on March 1, 2020, and who had lived in Denmark
for at least 1 year prior to that date. They compiled individual information
for participants for the year 2019 from the Danish national registers,
including information on marital status, education, occupational status,
wealth, family or household income, ethnicity, and household size. They also
included several contextual variables that described the communities in
which people lived. These contextual variables were defined at the parish
level with data from 2019 and included population density, mean income,
median wealth, percent unemployment, percent primary or lower education, SES
difference between municipality and parish, municipality-level access to
healthcare, lung cancer incidence rate, and diabetes incidence rate.
The investigators also linked data from the Danish National Patient Register
to identify whether participants also had relevant comorbidities, namely
cardiovascular disease, respiratory disease, lung cancer, diabetes, or
dementia. Finally, they linked cohort participants to COVID-19 data from the
Danish Health Authority to define the following COVID-19–related
outcomes: incidence (defined as first positive polymerase chain reaction
[PCR] test), hospitalization (defined as hospital admission for more than 12
hours within 14 days after the first positive PCR test), and death (defined
as death from any cause within 30 days of the detection of a COVID-19
infection). These definitions for COVID-19 incidence, hospitalization, and
death are key study design details that will be discussed below.
Exposure Assignment
Andersen and colleagues used information from the integrated Danish Eulerian
Hemispheric chemical transport model, which is an atmospheric chemical
transport model developed to study the long-range transport of air pollution
across the Northern Hemisphere (Brandt et al. 2012), and the Urban Background Model, which is used
for calculating background air pollution over Denmark with high spatial
resolution (Brandt et al. 2003) to
derive exposure estimates. For their main analyses, they assigned annual
estimates of PM2.5, PM10, BC, NO2, and
O3 from the models for the year 2019 at a 1 × 1 km
spatial resolution to cohort participants’ address of residence at
baseline (i.e., March 1, 2020).
Additionally, they assigned annual mean concentrations of PM2.5,
BC, NO2, and O3 for the year 2010 at a 100 ×
100 m spatial resolution from the European-wide hybrid land use regression
(LUR) model (de Hoogh et al. 2016)
developed within the Effects of Low-Level Air Pollution: A Study in Europe
(ELAPSE) project (http://www.elapseproject.eu/). This model was
developed with a combination of observations from ground-based monitors,
satellite data, dispersion model estimates, land use data, and traffic
variables.
Main Epidemiological Analyses
The main statistical analyses for this study consisted of Cox proportional
hazard models to examine associations between air pollution exposure in
single-pollutant models and COVID-19 outcomes, following cohort participants
until the date of death, emigration, or the end of follow-up on April 26,
2021. The investigators explored models with three levels of increasing
adjustment for potential confounders. Model 1 adjusted for calendar time,
age, sex, and region of residence; Model 2 added the individual-level
variables listed above (i.e., marital status, highest completed education,
occupational status, individual wealth, family income, and household size);
and Model 3 added the contextual-level variables (i.e., municipality-level
access to healthcare and parish-level population density, mean income,
median wealth, percent unemployment, percent primary or low education, and
the SES difference between municipality and parish). Hazard ratios (HRs)
were estimated per interquartile range increases in exposure estimates,
namely 0.55 μg/m3 for PM2.5, 1.14
μg/m3 for PM10, 0.09
μg/m3 for BC, 3.49 μg/m3 for
NO2, and 2.79 μg/m3 for O3.
Additional Epidemiological Analyses
The investigators performed many sensitivity analyses. Because there were
changes over time due to differences in testing capacity, various
pandemic-related restrictions and protection measures, and COVID-19 strains,
they estimated associations separately in two pandemic waves, namely March 1
to July 31, 2020, and August 1, 2020, to April 26, 2021. They also evaluated
effect modification of the associations between exposures and the various
outcomes by age, sex, SES, ethnicity, and comorbidities.
The investigators used similar statistical approaches to those in the main
analyses to examine associations between exposure and COVID-19
hospitalization and death in a subgroup of individuals who had tested
positive for COVID-19 (i.e., hospitalization or death within 30 days of a
positive test). They also examined models in which they controlled for
municipality-level monthly COVID-19 positivity rates and estimated
exposure–response functions to evaluate the shape of the associations
between pollutants and each outcome by applying natural cubic splines with
three degrees of freedom. Finally, they examined two-pollutant models for
pollutant combinations where the Pearson correlation coefficient was less
than 0.7 and replicated their main analyses with the ELAPSE-derived
pollutant exposures.
SUMMARY OF KEY FINDINGS
COHORT AND EXPOSURE CHARACTERISTICS
The full study cohort included 3,721,813 Danish adults. In total, 138,742
individuals tested positive for COVID-19, 11,270 were hospitalized, and 2,557
died from COVID-19 during the 14 months of follow-up. Subjects who died or who
were hospitalized from COVID-19, or those who died from any cause, were more
likely to be men, less highly educated, unemployed, not married or living with a
partner, or having lower income, as compared to those in the full cohort. The
vast majority of positive tests, hospitalizations, and deaths were observed in
the second pandemic wave.
Mean estimates of annual exposures (and standard deviations) to PM2.5,
PM10, BC, NO2, and O3 in 2019 based on the
main exposure model were 7.4 (0.5), 12.7 (0.9), 0.3 (0.1), 10.7 (2.4), and 54.5
(2.2) μg/m3, respectively, and were slightly higher among
COVID-19 cases than for the total population.
Exposures estimated by the ELAPSE model were higher than those estimated by the
main model, but they showed moderate to good correlation with each other (e.g.,
r = 0.51 for PM2.5, 0.63 for NO2, and
0.47 for both BC and O3).
EPIDEMIOLOGICAL RESULTS
Main Findings
Andersen and colleagues found elevated risks of all three COVID-19 outcomes
associated with exposures to PM2.5, PM10, BC, and
NO2 (Commentary
Figure). They found inverse associations, however,
between exposure to O3 and the three outcomes. Estimates of risk
for the COVID-19 outcomes were largely unchanged after adjustment for the
individual-level characteristics (i.e., Model 2 compared to Model 1), but
were attenuated substantially when adjusted for the contextual variables
(i.e., Model 3). In the case of all-cause mortality, however, estimates
remained essentially unchanged across all three levels of model
adjustment.
Associations between estimated annual average pollutant
concentrations and mortality among cohort participants.
Data shown are hazard ratios and 95% confidence intervals estimated
per interquartile range increases in 1-year mean exposure, namely:
0.55 μg/m3 for PM2.5, 1.14
μg/m3 for PM10, 0.09
μg/m3 for BC, 3.49 μg/m3 for
NO2, and 2.79 μg/m3 for
O3. Results are from the analyses using all available
individual- and contextual-level variables (Model 3). (Source:
Investigators’ Report Table 3.)
Risks of increased COVID-19 incidence and hospitalizations using Model 3 were
strongest with exposure to NO2 (i.e., HRs and 95% confidence
intervals (CIs): 1.18 [1.14–1.23] and 1.19 [1.12–1.27],
respectively), but risk of COVID-19 mortality was strongest with exposure to
PM2.5 (i.e., HR and 95% CI: 1.23 [1.04–1.44]; Commentary Figure).
Andersen and colleagues also compared COVID-19 deaths with deaths from all
causes. They reported elevated risk of all-cause mortality associated with
exposures to PM2.5, BC, and NO2 (Commentary Figure). Deaths from COVID-19 associated
with PM and NO2 were much higher than those from all causes.
Results of Additional Analyses
Analyses with the exposure estimates from the ELAPSE model showed strong and
significantly positive associations with all COVID-19 outcomes and with
all-cause mortality and were comparable to those observed with the main
exposure model.
The investigators found no associations during the first wave of the pandemic
but found significant and positive associations between PM2.5 BC,
and NO2 and all three COVID-19 outcomes during the second wave
when the number of cases, hospitalizations, and deaths were much higher.
One of the aims of the study was to identify whether any subgroup of the
population was more susceptible to air pollution–related COVID-19
incidence. Here, they found that those aged 65 years and older experienced
greater risks associated with NO2 exposure (compared to younger
people) and those of lower SES (according to several indicators) had greater
risks associated with both NO2 and PM2.5 exposures
(compared to those of higher SES). The investigators also reported greater
risks for COVID-19 incidence with PM2.5 and NO2
exposures among those who had pre-existing cardiovascular and respiratory
disease comorbidities and among individuals who had dementia and diabetes,
although not all of these differences were statistically significant.
In analyses restricted to individuals who tested positive for COVID-19, they
found that exposures to PM2.5 and NO2 were associated
with increased risks of hospitalizations (i.e., HRs 1.04 [CI:
1.01–1.08] and 1.06 [CI: 1.10–1.12], respectively), but no
association was observed with the other pollutants. The risks in this
subgroup were notably smaller than those reported with the full cohort (see
Commentary Figure: HRs 1.09
[CI: 1.01–1.17] and 1.19 [CI: 1.12–1.27], respectively). In
this same subgroup, PM10 was inversely associated with risk of
COVID-19 mortality, but all other pollutants were unrelated to this
outcome.
The exposure–response functions were linear or curvilinear for the
majority of the pollutants and COVID-19 outcomes. Finally, analyses using
two-pollutants models showed that associations, especially for
PM2.5 adjusted for NO2 and O3, were
attenuated substantially. Associations with PM10 were the most
robust to adjustment for other pollutants.
HEI REVIEW COMMITTEE’S EVALUATION
EVALUATION OF STUDY DESIGN, DATASETS, AND EPIDEMIOLOGICAL APPROACHES
This study represents an important contribution to our knowledge about potential
associations between long-term exposure to air pollution and
COVD-19–related health outcomes. Major strengths of the study design were
the inclusion of the full Danish population and the rigorous adjustments for
individual- and contextual-level SES characteristics. The report presented
estimates of risks for three COVID-19–related outcomes associated with
exposures to five pollutants (i.e., PM2.5, PM10, BC,
NO2, and O3) and found increased risks associated with
all but O3. Elevated risks for hospitalizations were seen both in the
general population and among those who tested positive for COVID-19. The
investigators also identified groups potentially most susceptible to air
pollution–related COVID-19 outcomes.
In its independent evaluation of the Investigators’ Report, the HEI Review
Committee agreed that the study documents that long-term exposures to ambient
air pollution appear to be associated with adverse COVID-19 morbidity and
mortality among Danish adults. A noted strength of this study is that during the
second wave of the pandemic, in particular, the investigators were able to
capture nearly all cases, as testing was widely available for free in Denmark
during this period. The Committee was also impressed with the use of
high-resolution exposure estimates for the five pollutants. They thought that
the exposure models used and the methods of assigning exposure estimates to
cohort participants were appropriate for these analyses.
Another strength of the study was that the investigators had access to
participants’ residential addresses for estimating exposures, whereas
many other epidemiological studies based on administrative data have used the
less precise approach of using the location of participant residential ZIP codes
or postal codes. Their ability to adjust for municipality-level access to
healthcare and municipality-level monthly COVID-19 positivity rates (as a proxy
for spatial and temporal pandemic development) was another important
characteristic of the study design.
The Committee liked that Andersen and colleagues were very thorough in their
analyses and conducted many sensitivity analyses, some of which are not included
in this summary. The Committee was impressed with their efforts at examining the
effects of different levels and combinations of covariate adjustment, testing
for effect modification by numerous individual-level characteristics, evaluating
two different sources of exposure predictions and multipollutant models, and
comparing their results between pandemic waves and among those who had tested
positive for COVID-19 separately.
The Committee agrees with the investigators that there are many challenges to
measuring cases of COVID-19 incidence, hospitalization, and death accurately. As
described earlier, here, the investigators defined incidence as having a first
positive PCR test and COVID-19 hospitalization as having been admitted within 14
days of the first positive PCR test. The Committee notes that the accuracy of
these data necessarily depends on voluntary participation in testing, testing
capacity, accessibility, cost, and accuracy, among other challenges, all of
which are likely to vary across Denmark and throughout the course of the
pandemic. That is, under-ascertainment of outcomes and variability of
under-ascertainment across the country are potential sources of bias. For
example, bias would be introduced if those living in urban areas, where
pollution levels would be greatest, had better access to testing than those
living in areas where pollution levels are lower. Potential differential
ascertainment in COVID-19 outcomes also has implications for the subgroup
analyses identifying susceptible populations because some subgroups (e.g.,
perhaps those of higher SES) might have had better access to testing. In the
second wave of the pandemic, however, PCR tests were widely and freely available
to all, making it therefore easier to ascertain cases. We would therefore expect
to have less bias related to case ascertainment in the analyses restricted to
the second wave of the pandemic as compared to the other analyses.
The investigators defined COVID-19 deaths as death from any cause within 30 days
of the detection of a COVID-19 infection, as confirmed by PCR test. That
definition also presents challenges to accuracy because those who are
hospitalized for any reason are more likely to be tested for COVID-19 (than
asymptomatic members of the general public) and are also more likely to die from
other, non–COVID-19 causes. For example, someone admitted to hospital
following a heart attack could also test positive for COVID-19 upon admission
and later die because of heart failure; however, according to this case
definition, their death would be attributed to COVID- 19 (i.e., spuriously
linking air pollution and a COVID-19 death). Thus, the outcomes defined in this
way likely capture a substantial number of hospitalizations and deaths that were
not related to COVID-19. Additionally, those who did in fact die of COVID-19
more than 30 days after the initial diagnosis would not be included in this
group.
Despite controlling for many individual- and contextual-level indicators of SES
in their epidemiological models, the investigators were unable to control for
some characteristics relevant for studying COVID-19, such as personal and local
patterns of adherence to public health measures (e.g., social distancing and
wearing of face masks). Some or all of these could be related to patterns of
pollution, and lack of adjustment for them could therefore be a source of bias.
Additionally, there might be differential associations according to different
COVID-19 strains that were not captured in the analyses.
Overall, however, the Committee was impressed with the quality of the
epidemiological datasets, general analytic approaches, and in particular the
large number of sensitivity analyses explored, although there were some
important limitations to them.
DISCUSSION OF THE FINDINGS AND INTERPRETATION
Generally, the Committee found that the report presented a balanced and accurate
presentation and interpretation of the study results. Some of the findings,
however, remained somewhat unexplained and difficult to interpret, including the
very elevated estimates of risk in many cases. For example, the investigators
reported that an increase in exposure to PM2.5 of only 0.5
μg/m3 was associated with an HR of 1.10 for COVID-19
incidence and an HR of 1.23 for COVID-19 mortality. For context, a recent
systematic review and meta-analysis of 71 cohort studies on long-term exposure
to PM2.5 and mortality reported an HR of only 1.08 for all-cause
mortality per 10 μg/m3 (Chen and Hoek 2020), and the ELAPSE pooled analysis of eight European
cohorts reported an HR 1.28 for all-cause mortality per 10
μg/m3 for PM2.5 (Strak et al. 2021). It is worth noting here that the
mean exposures to pollutants in this study were relatively low and had limited
variability in some cases, which make it difficult to compare with findings from
locations where exposures are higher or have greater ranges. Regardless, the
estimates of risk for mortality reported by Andersen and colleagues are much
greater than those observed elsewhere and suggest that there might be important
unaccounted sources of bias in the study although the source of bias was not
readily apparent.
Other results that are difficult to explain included the weaker associations
among those who had tested positive for COVID-19 (as compared to among the full
cohort). This finding could suggest that air pollution is acting more on the
development of disease than on its progression, yet in the full population,
associations were much stronger for COVID-19 mortality than incidence or
hospitalization. As such, it is possible that there remained bias due to who was
getting infected or tested. Similarly, the investigators showed that controlling
for municipality-level monthly COVID-19 positivity rates did not affect their
results, whereas one might have expected that to have attenuated the
associations. The fact that associations between air pollution exposures and
COVID-19 were limited to the second wave could be because the more limited
testing in the first wave made it more difficult to detect associations, or it
could be related to differences in the virus strains in the two waves.
In addition to the very strong associations reported with PM2.5, the
inverse associations between exposure to O3 and the various outcomes
are difficult to explain. The inverse associations between several health
outcomes and O3, however, are generally consistent with several other
recent European studies (e.g., Stafoggia et al. 2022; Strak et al. 2021; Veronesi et al. 2022). It is possible that this finding reflects atmospheric chemistry
in the environment under which ozone reacts with other pollutants to form new
unmeasured but toxic components.
For the other pollutants, Andersen and colleagues observed that the risks for
COVID-19 incidence and hospitalizations were both highest with exposures to
NO2. NO2 is often considered a marker of locally
varying, traffic-related air pollution, as compared to PM2.5, which
might better represent regional variation in air quality arising from
non– traffic-related sources. As such, these findings might reflect the
biological importance of traffic-related pollution for these relationships or
might have captured part of the population that showed more movement in and out
of their homes and thus were exposed to more opportunities for disease
transmission. Collectively, these findings add to a somewhat inconclusive
literature on this topic. One recent systematic review by Hernandez Carballo and
colleagues (Hernandez Carballo et al. 2022) summarized findings from 116 studies that report 355
combinations of different pollutant-COVID-19 outcomes and found that only about
half of those on incidence or mortality reported statistically significant
increased risks associated with exposure. Among those that did find positive
associations, incidence was associated most strongly with exposures to
PM2.5, PM10, NO2, O3, and carbon
monoxide, whereas COVID-19 deaths were associated most strongly with
PM2.5 and NO2. Notably, Hernandez Carballo and
colleagues concluded that most studies included in the review exhibited high
risk of confounding and outcome measurement bias. A separate systematic review
and meta-analysis (Sheppard et al. 2023) severity, and deaths. However, such studies are unable to account
for individual-level differences in major confounders like socioeconomic status
and often rely on imprecise measures of PM2.5 reported that a
10-μg/m3 increase in PM2.5 was associated with
a 1.66 (95% CI: 1.31–2.11) increased odds of COVID-19 infection
(N = 7) and a 1.40 increased odds of mortality
(N = 5), both of which are much lower than the equivalent
risks of 6.04 and 49.70 reported here. Evidence from the rapidly expanding
literature on this topic therefore remains mixed, both in terms of findings and
in quality of study designs.
CONCLUSIONS
In summary, this study represents an important contribution to our knowledge
about potential associations between long-term exposure to air pollution and
COVD-19–related health outcomes. The study design is a great improvement
over others in the currently available literature on this topic due to the more
complete capture of cases and the rigorous adjustments for individual- and
contextual-level SES characteristics.
The report demonstrated large, elevated risks for three different
COVID-19–related outcomes associated with exposures to four pollutants
(i.e., PM2.5, PM10, BC, and NO2). These
findings were largely robust to sensitivity analyses although some differences
between waves of the pandemic, lower risks among those with COVID-19 diagnoses,
and the very large effect sizes leave some concerns about residual bias.
This is one of the first cohort studies and the first study funded by HEI to
investigate the association between air pollution and COVID-19. The rich
epidemiological datasets used, which included many individual-level
characteristics for all adults in Denmark, allowed the investigators to address
some of the major limitations of previous ecological studies on this topic.
Limitations remained, however, regarding how the outcomes were defined and
measured and the inability to control several pandemic-related issues, including
adherence to public health guidelines. Ultimately, this study has documented
that long-term exposures to ambient air pollution do appear to be associated
with adverse COVID-19 morbidity and mortality among Danish adults.
ACKNOWLEDGMENTS
The HEI Review Committee thanks the ad hoc reviewers for their help in evaluating the
scientific merit of the Investigators’ Report. The Committee is also grateful
to Eva Tanner for her oversight of the study, to Dan Crouse for assistance with
review of the report and in preparing its Commentary, to Mary Brennan for editing
this Report and its Commentary, and to Kristin Eckles and Hope Green for their roles
in preparing this Research Report for publication.
Footnotes
* A list of abbreviations and other terms appears at the end of this
volume.
REFERENCES
Bashir MF, Ma BJ, Bilal Komal B, Bashir MA, Farooq TH, et al. 2020. Correlation
between environmental pollution indicators and COVID-19 pandemic: A brief
study in Californian context. Environ Res
187:109652; doi:10.1016/j.
envres.2020.109652.
[DOI] [PMC free article] [PubMed] [Google Scholar]
Brandt J, Christensen JH, Frohn LM, Berkowicz R. 2003. Air pollution
forecasting from regional to urban street scale ––
Implementation and validation for two cities in Denmark.
Phys Chem Earth
28:335–344;
doi:10.1016/S1474-7065(03)00054-8. [Google Scholar]
Brandt J, Silver JD, Frohn LM, Geels C, Gross A, Hansen AB, et al. 2012. An
integrated model study for Europe and North America using the Danish
Eulerian Hemispheric Model with focus on intercontinental transport of air
pollution. Atmos Environ
53:156–176;
doi:10.1016/j.atmosenv.2012.01.011. [Google Scholar]
Chen J, Hoek G. 2020. Long-term exposure
to PM and all cause and cause-specific mortality: A systematic review and
meta-analysis. Environ Int
143:105974; doi:10.1016/j.
envint.2020.105974.
[DOI] [PubMed] [Google Scholar]
Coker ES, Cavalli L, Fabrizi E, Guastella G, Lippo E, Parisi ML, et al. 2020. The effects
of air pollution on COVID-19 related mortality in Northern
Italy. Environ Resour Econ (Dordr)
76:611–634;
doi:10.1007/s10640-020-00486-1.
[DOI] [PMC free article] [PubMed] [Google Scholar]
Cole MA, Ozgen C, Strobl E. 2020. Air pollution
exposure and Covid-19 in Dutch municipalities.
Environ Resour Econ (Dordr)
76:581–610;
doi:10.1007/s10640-020-00491-4.
[DOI] [PMC free article] [PubMed] [Google Scholar]
Copat C, Cristaldi A, Fiore M, Grasso A, Zuccarello P, Signorelli SS, et al. 2020. The role of
air pollution (PM and NO2) in COVID-19 spread and lethality: A
systematic review. Environ Res
191:110129;
doi:10.1016/j.envres.2020.110129.
[DOI] [PMC free article] [PubMed] [Google Scholar]
de Hoogh K, Gulliver J, van Donkelaar A, Martin RV, Marshall JD, Bechle MJ, et al. 2016. Development
of West-European PM2.5 and NO2 land use regression
models incorporating satellite-derived and chemical transport modelling
data. Environ Res
151:1–10;
doi:10.1016/j.envres.2016.07.005.
[DOI] [PubMed] [Google Scholar]
Health Effects Institute (HEI); HEI
Panel on the Health Effects of Long-Term Exposure to Traffic-Related Air
Pollution. 2022. Systematic Review and
Meta-analysis of Selected Health Effects of Long-Term Exposure to
Traffic-Related Air Pollution. Special Report
23. Boston,
MA:Health Effects
Institute. [Google Scholar]
Hernandez Carballo I, Bakola M, Stuckler D. 2022. The impact of air
pollution on COVID-19 incidence, severity, and mortality: A systematic
review of studies in Europe and North America.
Environ Res
215:114155; doi:10.1016/j.
envres.2022.114155.
[DOI] [PMC free article] [PubMed] [Google Scholar]
Katoto PDMC, Brand AS, Bakan B, Obadia PM, Kuhangana C, Kayembe-Kitenge T, et al. 2021. Acute and
chronic exposure to air pollution in relation with incidence, prevalence,
severity and mortality of COVID-19: A rapid systematic
review. Environ Health
20:41;
doi:10.1186/s12940-021-00714-1.
[DOI] [PMC free article] [PubMed] [Google Scholar]
Konstantinoudis G, Padellini T, Bennett J, Davies B, Ezzati M, Blangiardo M. 2021. Long-term exposure
to air-pollution and COVID-19 mortality in England: A hierarchical spatial
analysis. Environ Int
146:106316; doi:10.1016/j.
envint.2020.106316.
[DOI] [PMC free article] [PubMed] [Google Scholar]
Liang D, Shi L, Zhao J, Liu P, Sarnat JA, Gao S, et al. 2020. Urban Air
Pollution May Enhance COVID-19 Case-Fatality and Mortality Rates in the
United States. Innovation (Camb)
1:100047;
doi:10.1016/j.xinn.2020.100047.
[DOI] [PMC free article] [PubMed] [Google Scholar]
Loaiza-Ceballos MC, Marin-Palma D, Zapata W, Hernandez JC. 2022. Viral respiratory
infections and air pollutants. Air Qual Atmos
Health
15:105–114;
doi:10.1007/s11869-021-01088-6.
[DOI] [PMC free article] [PubMed] [Google Scholar]
Monoson A, Schott E, Ard K, Kilburg-Basnyat B, Tighe RM, Pannu S, et al. 2023. Air
pollution and respiratory infections: The past, present, and
future. Toxicol Sci
192:3–14;
doi:10.1093/toxsci/kfad003.
[DOI] [PMC free article] [PubMed] [Google Scholar]
Sheppard N, Carroll M, Gao C, Lane T. 2023. Particulate matter
air pollution and COVID-19 infection, severity, and mortality: A systematic
review and meta-analysis. Sci Total Environ
880:163272;
doi:10.1016/j.scitotenv.2023.163272.
[DOI] [PMC free article] [PubMed] [Google Scholar]
Stafoggia M, Oftedal B, Chen J, Rodopoulou S, Renzi M, Atkinson RW, et al. 2022. Long-term
exposure to low ambient air pollution concentrations and mortality among 28
million people: Results from seven large European cohorts within the ELAPSE
project. Lancet Planet Health
6:e9–e18;
doi:10.1016/ S2542-5196(21)00277-1.
[DOI] [PubMed] [Google Scholar]
Strak M, Weinmayr G, Rodopoulou S, Chen J, de Hoogh K, Andersen ZJ, et al. 2021. Long-term
exposure to low level air pollution and mortality in eight European cohorts
within the ELAPSE project: Pooled analysis.
BMJ
374:n1904;
doi:10.1136/bmj.n1904.
[DOI] [PMC free article] [PubMed] [Google Scholar]
Thurston GD, Kipen H, Annesi-Maesano I, Balmes J, Brook RD, Cromar K, et al. 2017. A joint
ERS/ATS policy statement: What constitutes an adverse health effect of air
pollution? An analytical framework. Eur Respir
J
49:1600419;
doi:10.1183/13993003.00419-2016.
[DOI] [PMC free article] [PubMed] [Google Scholar]
Travaglio M, Yu Y, Popovic R, Selley L, Leal NS, Martins LM. 2021. Links between air
pollution and COVID- 19 in England. Environ
Pollut
268:115859; doi:10.1016/j.
envpol.2020.115859.
[DOI] [PMC free article] [PubMed] [Google Scholar]
Veronesi G, Matteis SD, Calori G, Pepe N, Ferrario MM. 2022. Long-term exposure
to air pollution and COVID-19 incidence: A prospective study of residents in
the city of Varese, Northern Italy. Occup Environ
Med
79:192–199;
doi:10.1136/ oemed-2021-107833.
[DOI] [PubMed] [Google Scholar]
Villeneuve PJ, Goldberg MS. 2020. Methodological
considerations for epidemiological studies of air pollution and the SARS and
COVID-19 coronavirus outbreaks. Environ Health
Perspect
128:095001;
doi:10.1289/EHP7411.
[DOI] [PMC free article] [PubMed] [Google Scholar]
Wu X, Nethery RC, Sabath MB, Braun D, Dominici F. 2020. Air pollution and
COVID-19 mortality in the United States: Strengths and limitations of an
ecological regression analysis. Sci Adv
6:eabd4049;
doi:10.1126/sciadv.abd4049.
[DOI] [PMC free article] [PubMed] [Google Scholar]
Yao Y, Pan J, Wang W, Liu Z, Kan H, Meng X, et al. 2020. Spatial
correlation of particulate matter pollution and death rate of
COVID-19. medRxiv;
doi:10.1101/2020.04.07.20052142. [Google Scholar]