
Figure 5.
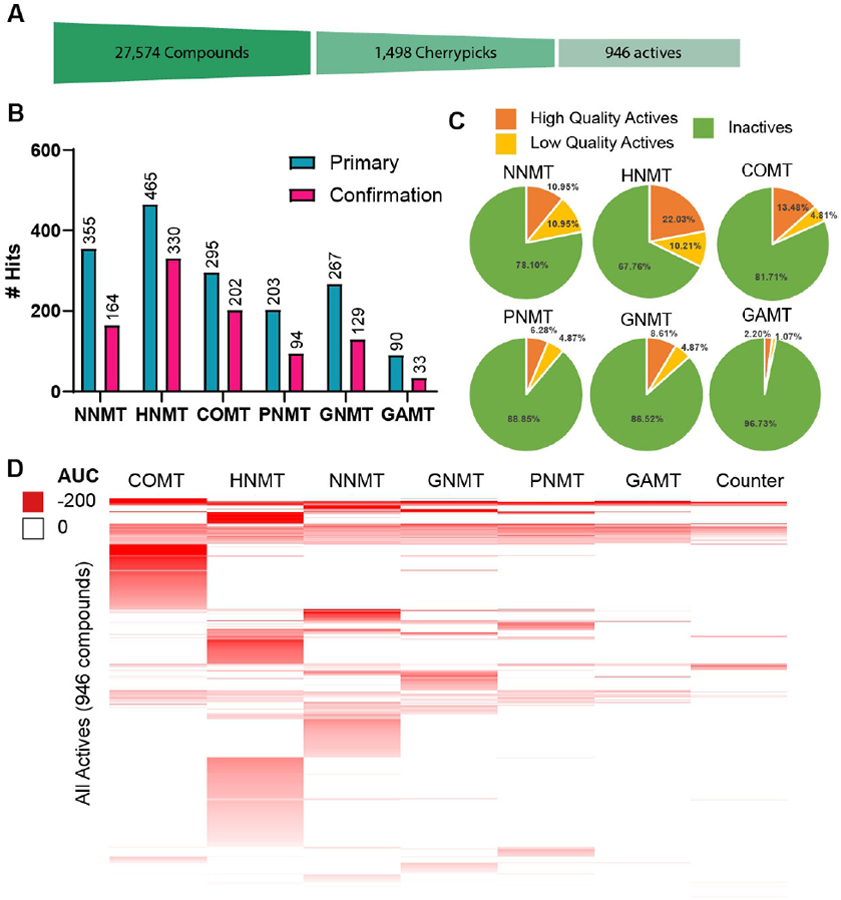
Hit rates for cherrypicked compounds. A) Cartoon depiction of the funnel-down approach to identifying hits. A total of 27,574 unique compounds were screened and 1,498 compounds were identified as initial hits suitable for cherrypicking. Out of those initial hits a total of 946 unique compounds were confirmed across each MTase assay. B) Initial hits for each SMMTase (turquoise) and confirmed hits (magenta). Note that hit numbers do not account for specificity, which is reflected in D. C) 1,498 compounds from the primary screen were selected for cherrypicking. Each compound was assayed against each Mtase and a counter assay in 11-point dose response. Hits were the identified as high-quality actives (complete dose-response curves, max Response ≤ −50, and IC50 ≤ 10 μM), low quality actives (shallow curves, single-point activity, or inconclusive), or inactive. D) Heat map showing activity profile of all active compounds against COMT, HNMT, NNMT, GNMT, PNMT, GAMT, and the counter assay. Compounds in this heat map are clustered by total activity across all seven assays.