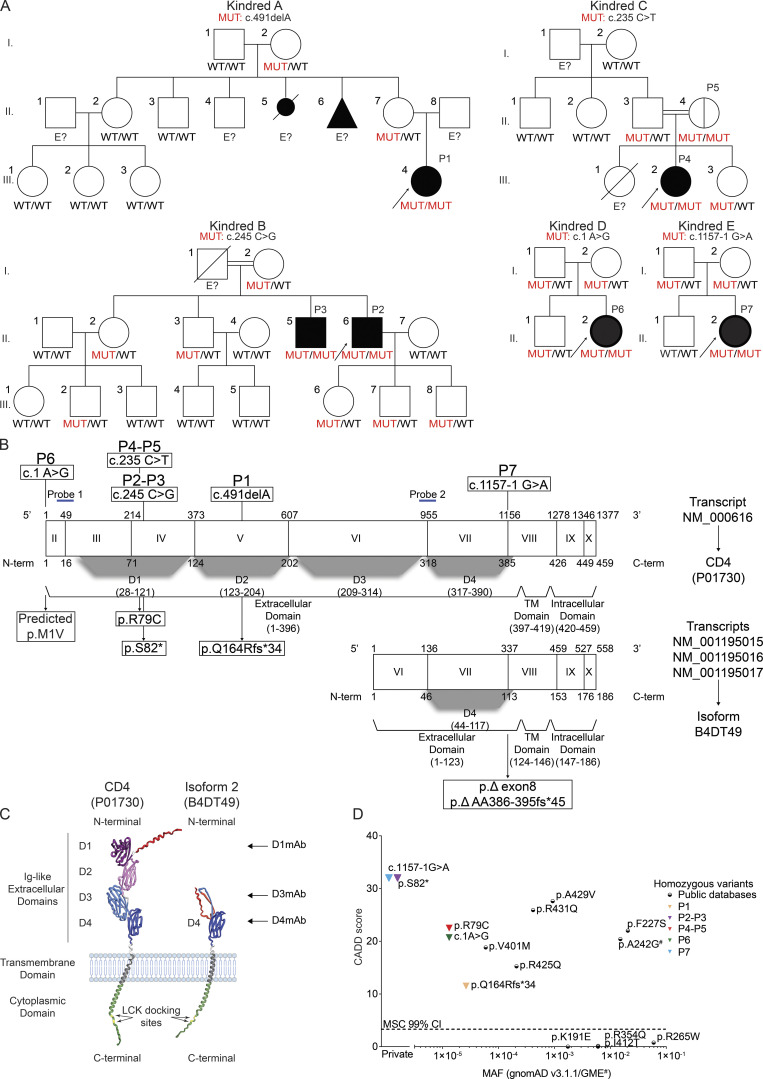
Figure 1.
Autosomal recessive CD4 deficiency. (A) Pedigree showing familial segregation of c.491delA (Kindred A), c.245C>G (Kindred B), c.235C>T (Kindred C), c.1A>G (Kindred D), and c.1157-1G>A (Kindred E). Individuals of unknown genotype are labeled "E?". (B) Schematic representation of four CD4 transcripts and their two corresponding isoforms. Exon numeration is based on NM_000616. Nucleotide (above) and amino acid (below) numeration are indicated based on each transcript/isoform. Protein domains are represented below each isoform. Patients’ variants are represented on NM_000616/CD4 (P01730). Two qPCR probes used in this study are represented by blue lines (probe 1: junction exon II–III; probe 2: junction exon VI–VII). (C) Alphafold representation CD4 and isoform 2 expressed at the cell surface with signal peptide (red), Ig-like extracellular domains (D1: purple; D2: pink; D3: light blue; D4: dark blue), transmembrane domain (dark gray), and cytoplasmic domain (green) with LCK docking sites (yellow). The different mAbs used in the study are also represented. (D) Minor allele frequency (MAF) and combined annotation-dependent depletion (CADD) score for all CD4 variants reported homozygous in public databases (circles) and found in patients (triangles). The mutation significance cutoff (MSC, 99% confidence interval [CI]) is represented by the dotted line. # indicates a variant only found in the GME database.

