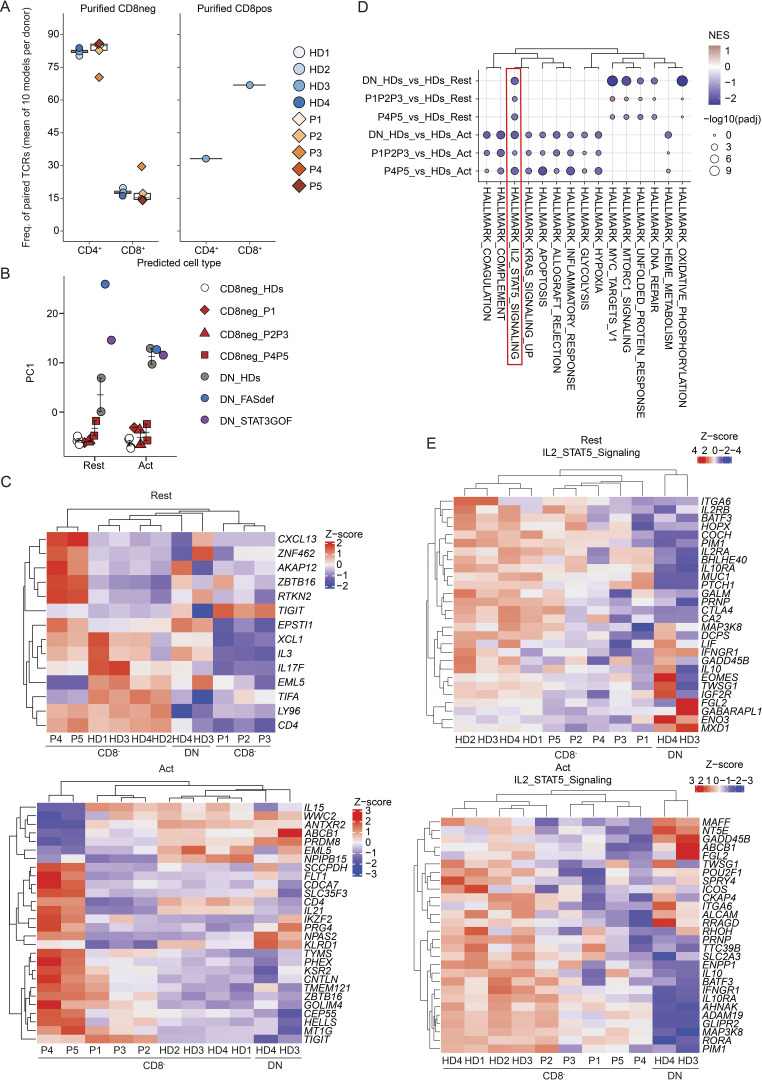
Figure 4.
Transcriptomic analysis of activated memory CD3+TCRαβ+CD8− T cells. (A) αβ sequences paired analysis following isolation, targeted capture, long-read sequencing, and bioinformatic sequence reconstruction at single nucleotide resolution. TCRαβ paired sequences from healthy donors (HDs, n = 4) and five CD4-deficient patients (P1–P5) were compared with public TCR sequence data. (B–E) scRNAseq analysis. Sorted memory CD3+TCRαβ+CD8− cells were stimulated with anti-CD2/CD3/CD28 beads for 20 h. Data from healthy donors (n = 4) and five patients (P1–P5), obtained in two batches of experiments, were integrated together with non-stimulated PBMC datasets obtained from the 10x Genomics web portal. As a comparison, memory CD3+TCRαβ+CD4−CD8− (DN) cells from two healthy donors (DN_HDs), FAS-deficient (DN_FASdef), and STAT3 GOF (DN_STAT3GOF) patients were also integrated. Cells transcriptionally similar to regulatory T, γδ T, and MAIT cells were excluded from the subsequent analyses. (B) Principal component (PC) analysis of resting (left) or activated (right) population. (C–E) Pseudobulk differential expression analysis between memory CD3+TCRαβ+CD8− cells from healthy donors (HD1–HD4_CD8neg) and patients (P1–P5_CD8neg). Patients with frameshift/nonsense variants (P1–P3) and missense variants (P4–P5) were separately compared to HDs. (C) Heatmap of significantly differentially expressed gene in patients compared to HDs (log2 fold change >1 or less-than −1; adjusted P value <10−3). Genes identified in either of the two comparisons (P1–P3_CD8neg versus HD1–HD4_CD8neg or P4–P5_CD8neg versus HD1–HD4_CD8neg) are shown. Results for (top) resting and (bottom) activated populations are shown separately. (D) Hallmark pathways found to be downregulated in stimulated memory CD3+TCRαβ+ DN cells from two healthy donors (DN_HDs) compared with stimulated memory CD3+TCRαβ+CD8− cells from 4 HDs and patients (P1–P5). Y axis represents comparisons; x axis represents gene sets reordered based on the non-supervised hierarchical clustering. Jaccard distance was calculated between each gene set based on their gene composition. (E) Heatmap analysis of leading-edge genes for the Hallmark IL-2/STAT5 signaling pathway identified through GSEA. Genes recurrently identified in the two comparisons (P1–P3_CD8neg versus HD1–HD4_CD8neg and P4–P5_CD8neg versus HD1–HD4_CD8neg) are shown. Results for (top) resting and (bottom) activated populations are shown separately.

