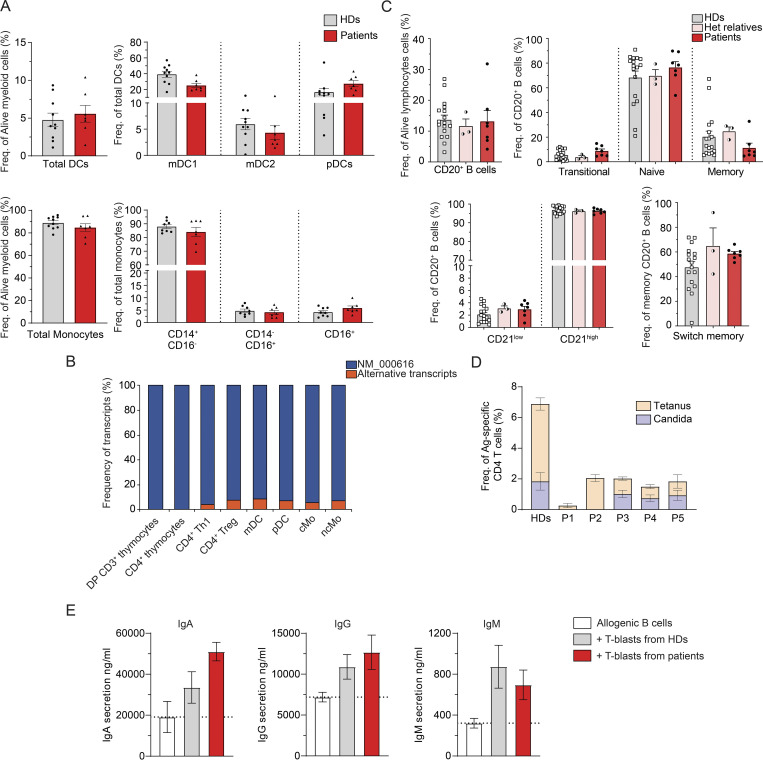
Figure 5.
Impact of CD4 deficiency on leukocyte development and differentiation. (A) Myeloid cell population frequencies in healthy donors (HDs, n = 10) and patients (P1–P7). Total DCs: Lin−HLADR+CD14−CD16−; mDC1: CD11c+CD123−CD141−CD1C+; mDC2: CD11c+CD123−CD141+CD1C−; pDC:CD11c−CD123+; total Mo: Lin−HLADR+CD14+/−CD16+/−. (B) Proportion of transcripts expression for different CD4 expressing cell types as determined by bulk RNA-seq considering sequenced reads spliced from exon 1 with exon 2 (NM_000616), versus with other exons, corresponding to alternative transcripts. (C) CD20+ B cell population frequencies in HDs (n = 18), heterozygous relatives (n = 3), and patients (P1–P7). Transitional: CD10+CD27−; naive: CD10−CD27−: memory: CD10−CD27+; isotype switched memory: IgD−IgM−. (D) Frequency of antigen (Ag)-specific CD4 T cells measured by flow cytometry following healthy donors (HD, n = 5) or patients’ (P1–P5) PBMCs in vitro stimulation with tetanus toxoid (tetanus, orange), or HKCA (heat-killed C. albicans, blue) for 2 days. (E) IgA (left), IgG (middle), and IgM (right) secretion detected by ELISA in the supernatant of allogenic B cells cultivated in vitro for 7 days alone (white) or with T-blasts from either healthy donors (gray, n = 8) or from patients (red, P1–P7). Data are representative of at least two independent experiments.

