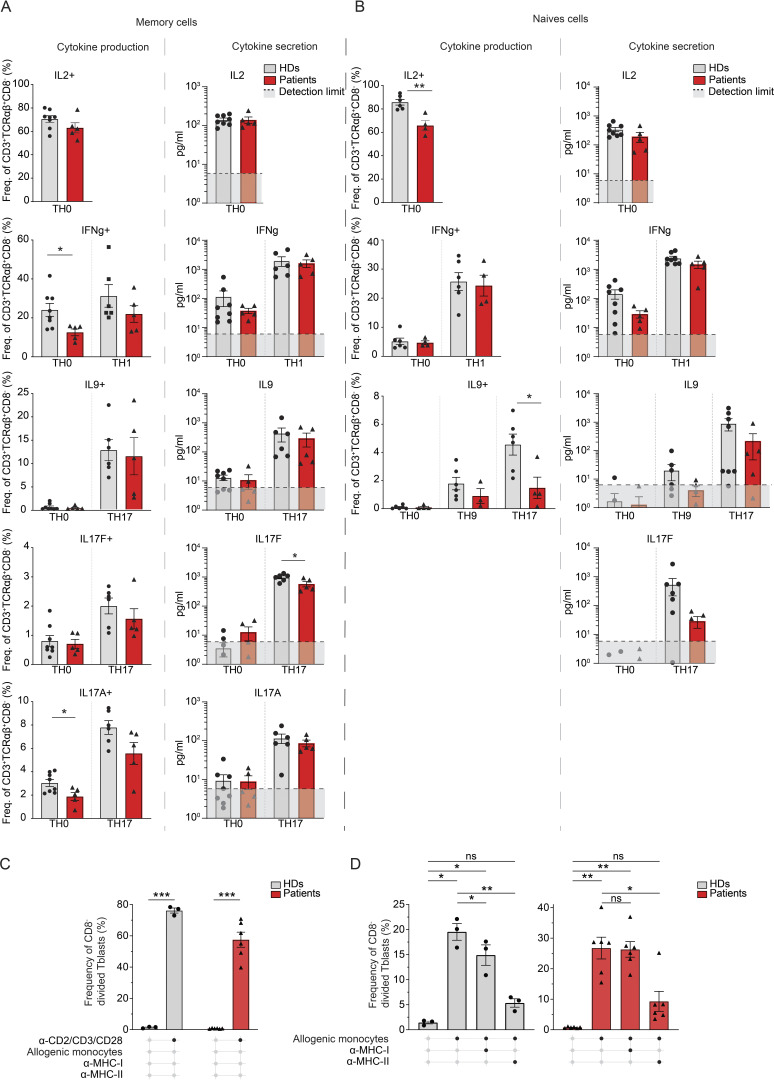
Figure 6.
Effector function of CD3+TCRαβ+CD8− T cells due to CD4 deficiency. (A and B) Frequency of indicated subset of healthy donors (HDs) and patients assessed by flow cytometry. Statistical analysis by unpaired Student’s t test. *P < 0.05; **P < 0.01. (A) Polarized memory CD3+TCRαβ+CD8− cells intracellular cytokine production (left) and secretion (right). The cytokine secretion limit of detection is indicated by a dashed line and a gray area. (B) Polarized naive CD3+TCRαβ+CD8− cells intracellular cytokine production (left) and secretion (right). The cytokine secretion limit of detection is indicated by a dashed line and a gray area. (C and D) Stimulation conditions are represented below histograms. Statistical analysis by one-way ANOVA with multiple comparisons (Tukey). ns: non-significant; *P < 0.05; **P < 0.01; ***P < 0.001. (C) Frequency of CD8− divided T-blasts from three healthy donors and six patients (P1–P6) after 5 days either non-stimulated or incubated with anti-CD2/CD3/CD28 beads or (D) either non-stimulated or cocultured with healthy donor allogenic pan Mo (mixed lymphocyte reaction) in presence or absence of HLA class I or class II blocking antibodies. Data are representative of at least two independent experiments.

