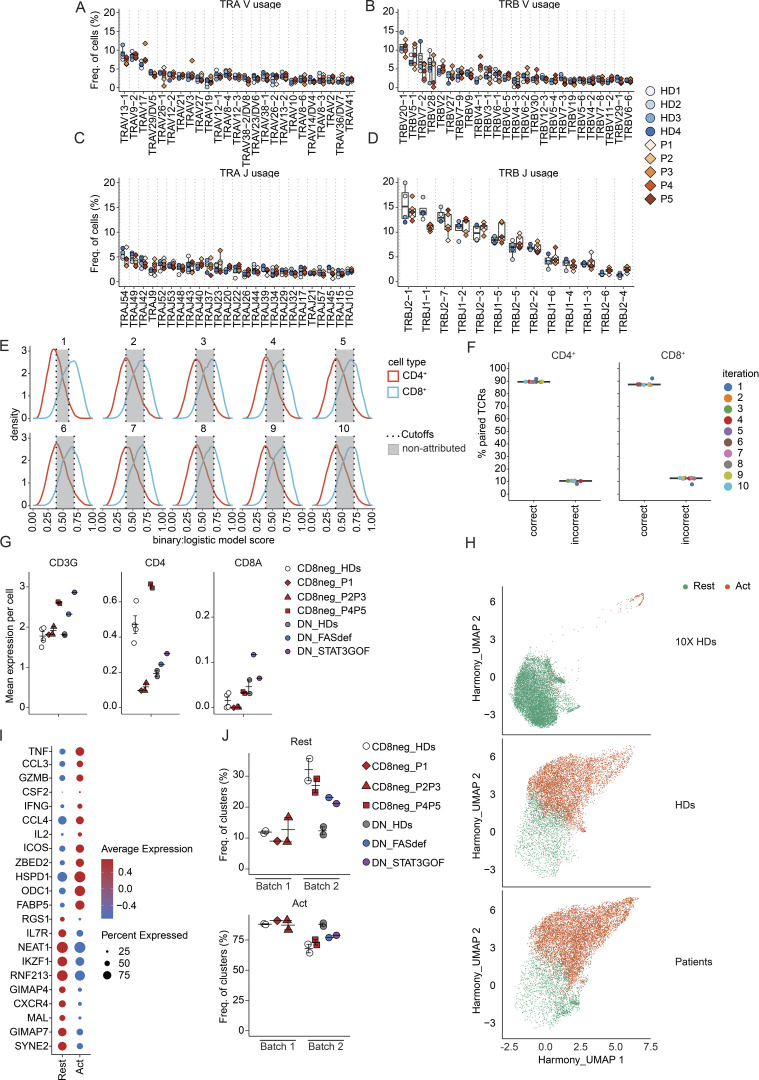
Figure S3.
Short- and long-read scRNAseq analysis of activated memory CD3+TCRαβ+CD8− T cells. (A–D) Diversity of the TCR repertoire (Vα, Vβ, Jα, and Jβ gene sequences) expressed by memory TCRαβ+CD8− T cells in four healthy donors and five patients (P1–P5) by high-throughput targeted long-read single-cell sequencing. (E) 10 iterations generated as a training set with subsampled known CD4+ and CD8+ TCRαβ sequences from Carter data. Accuracy threshold to correctly predict CD4+ (true positive) and CD8+ (true positive) was set based on the fifth percentile for the CD8 distribution and the 95th percentile for the CD4 distribution. The red curve represents CD4+ predicted frequency, and the blue curve represents CD8+ predicted frequency. The gray area represents not attributed cells. (F) Prediction accuracy after removing not-attributed cells. (G–I) scRNAseq analysis of stimulated memory CD3+TCRαβ+CD8− cells from four healthy donors (CD8neg_HDs) and five patients (CD8neg_P1–P5) as well as stimulated memory CD3+TCRαβ+ DN cells from two healthy donors (DN_HDs), FAS-deficient (DN_FASdef), and STAT3 GOF (DN_STAT3GOF) patients. (G) Mean single-cell-level expression of CD3G (left), CD4 (middle), and CD8A (right) mRNA. (H) UMAP plots showing resting (Rest, green) and activated (Act, orange) clusters. (I) Dot plot representing the top differentially expressed genes in resting versus activated clusters. (J) Proportion of resting and activated clusters in each sample. Data are representative of at least two independent experiments.

