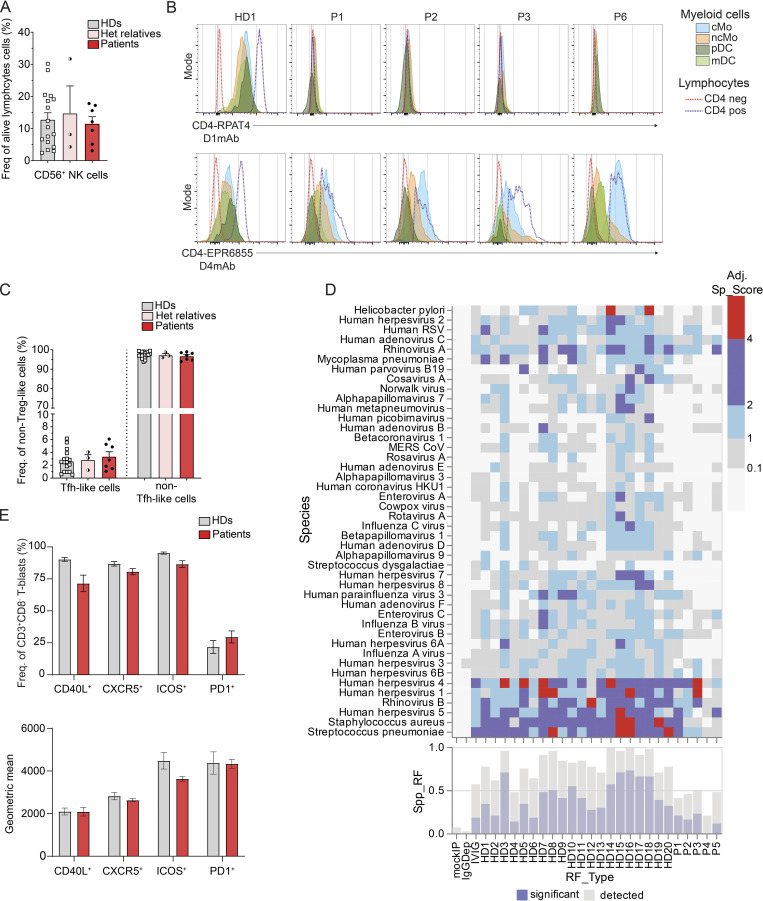
Figure S4.
Effect of CD4 deficiency on NK cells, myeloid cells, Tfh cells, and antiviral antibody responses. (A) CD56+ subset NK cell frequencies in healthy donors (HDs), heterozygous relatives, and patients (P1–P7). (B) Flow cytometry following extracellular staining of T-blasts from one representative HD. and patients shown to express isoform 2 (P1–P3, P6). Top: CD4 D1mAb (RPAT4); bottom: CD4 D4mAb (EPR6855). cMo: Lin−HLADR+CD14+CD16−, light blue; ncMo: Lin−HLADR+CD14+/−CD16+, orange; mDC: Lin−HLADR+CD14−CD16−CD11c+CD123−, light green; pDC: Lin−HLADR+CD14−CD16−CD11c−CD123+, dark green. (C) CD3+TCRαβ+CD8−CXCR5+ Tfh-like cell frequency in HDs, heterozygous relatives, and patients (P1–P7). (D) Antiviral antibody responses to species for which at least one sample tested seropositive by Phage ImmunoPrecipitation Sequencing. “IVIG” corresponds to the mean response for samples from pooled patients on IVIGs, mock IP samples, and IgG-depleted serum. The heatmap shows adjusted virus score values for each sample as a color gradient from blue if antibodies were detected but below our significance cut-off values, through purple to red if the adjusted virus score values were above our significance cut-off values. The bar plot (bottom) illustrates the size of the antibody repertoire for a given sample, indicating the precise number of different species for which peptides were enriched (light blue) and the number of different species for which the adjusted virus score values exceeded the cut-off values for significance (dark blue). (E) Top: Frequency of CD3+CD8− T-blasts from healthy donors (n = 8, gray) and patients (P1–P7, red) expressing canonical Tfh markers CD40L, CXCR5, ICOS, or PD1. Bottom: Geometric mean of CD40L, CXCR5, ICOS, or PD1. Data are representative of at least two independent experiments.

