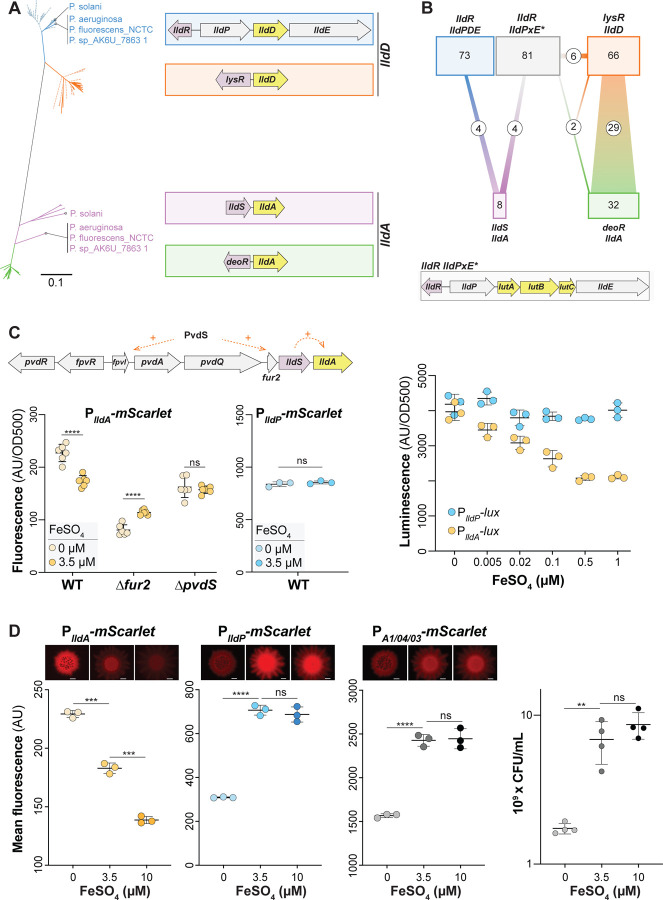
Figure 4. lldA, but not lldPDE, expression is sensitive to iron availability.
(A) Phylogenetic tree of lldD and lldA genes obtained from 213 pseudomonad genomes. Only one representative strain per species was included, unless strains showed different lld arrangements. Blue and orange lines represent genes with homology to lldD while green and purple lines represent genes with homology to lldA. Dotted lines indicate strains with one L-iLDH; solid lines indicate strains with more than one. The color of each cluster corresponds to the outlines surrounding the gene arrangement patterns in the panel on the right. Species/strain name is written if the strain has two L-iLDH genes. Only eight Pseudomonas species (including P. aeruginosa) possess the lldS-lldA gene arrangement outlined in purple. (B) Diagram depicting genome associations for the arrangement patterns shown (A) (indicated by a consistent color coding). An additional gene locus with the L-lactate utilization genes lutABC, which is not reflected in the tree, is outlined in gray and depicted at the bottom of this panel. The number of species possessing each gene arrangement is indicated in its corresponding box, and the connections represent the number of species with multiple L-iLDHs and their corresponding gene arrangements. (C) Top: In P. aeruginosa, lldS-lldA lies directly downstream of several genes involved in iron regulation and uptake. Left: lldA promoter activity in liquid cultures of WT, ∆fur2, and ∆pvdS strains grown in MOPS medium containing 40 mM L-lactate with ferrous sulfate added (3.5 µM) or no iron added (0 µM). Fluorescence values were taken 5–6 hours after the onset of stationary phase. Center: lldPDE promoter activity under the same conditions used for the PlldA reporter. Right: lldA and lldPDE promoter activity assayed using luciferase reporters. Cultures were grown in MOPS liquid medium with 40 mM L-lactate and ferrous sulfate was added as indicated. The maximum luminescence value for each condition is shown for each reporter. (D) Representative top-down fluorescent biofilm images and quantification of the average fluorescence across the width of the center of the biofilm for lldA reporter (left), lldPDE reporter (center left), and constitutive mScarlet (center right) strains. Biofilms were grown on MOPS medium with 20 mM succinate and 10 mM L-lactate, amended with ferrous sulfate as indicated. Scale bars = 2 mm. Right: Quantification of colony forming units of biofilms grown under each iron-amendment condition. Each dot is representative of a biological replicate and error bars represent standard deviation. **p<0.01, ***p<0.001, ****p<0.0001, ns = not significant.

