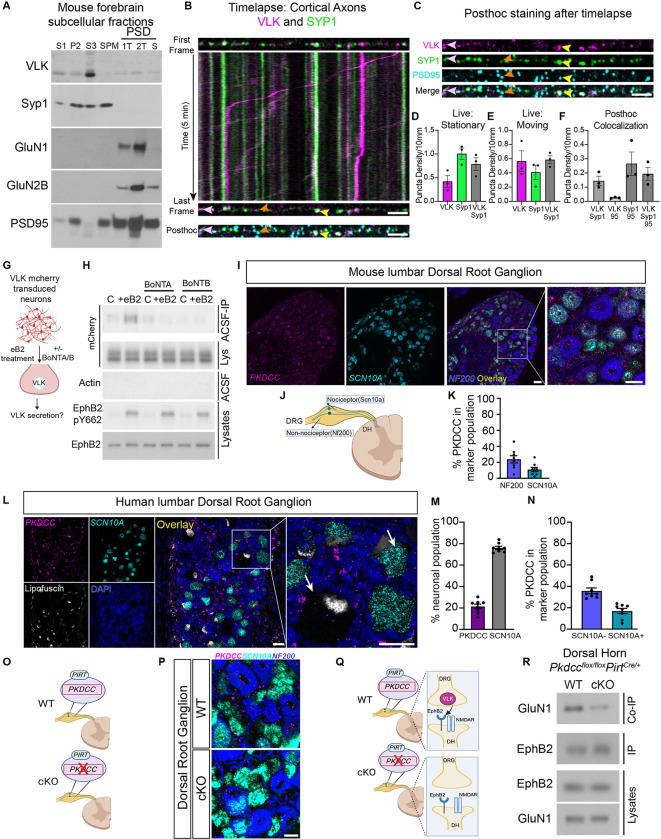
Fig. 3. VLK is enriched in the presynaptic terminal and presynaptic VLK KO downregulates postsynaptic EphB-NMDAR interaction.
(A) Western blots of PSD purification fractions prepared from WT CD1 mouse brain show VLK is enriched in crude vesicle fraction (S3). Gels were loaded with non-synaptic (S1), crude synaptosomal (P2), crude synaptic vesicle (S3), synaptic plasma membrane (SPM), and postsynaptic density (PSD) fractions. PSD fractions (from left to right) are least insoluble first triton extraction (1T), second triton extraction (2T), and most insoluble sarcosyl extraction (S). Blots were probed with VLK, Syp1, GluN1, GluN2B, and PSD-95 (as indicated). (B) The First and Last frame of the same axon segment from cultured rat cortical neurons (DIV21–23) transfected with VLK-mCherry (VLK, magenta), Synaptophysin1-EGFP (Syp1, green). mTurquoise was transfected as a cell fill (omitted for clarity). Kymograph generated from the indicated axon showing time (Y axis) vs distance (X axis). The same axon segment was fixed after live imaging and stained for PSD-95 (Posthoc, cyan). Scale bar is 5μm. Yellow arrowhead shows an example of colocalized VLK and Syp1 that remain stationary during live imaging and colocalize with PSD95. Pink arrowhead shows an example of colocalized VLK and Syp1 that remain stationary during live imaging but do not colocalize with PSD95. Orange arrowhead shows an example of Syp1 that remains stationary and colocalized with PSD95. (C) The individual channels for VLK, Syp1, PSD95 and Merged are shown for the same axon segment as (B) above. Scale bar is 5μm (D-E) Graph depicting the density of stable and moving VLK (magenta), Syp1 (green) and VLK+Syp1 (gray). (F) Graph depicting the puncta density of colocalized puncta after posthoc staining with PSD95 (95) VLK and Syp1 that remained stationary during live imaging and were maintained after fixation were quantified. (G) Schematic illustrating the experiment to test if ephrin B2 (eB2) stimulated VLK secretion from neurons can be blocked by botulinum toxins, A or B (BoNT A/B). (H) Cultured cortical neurons were transduced with lentivirus expressing VLK-mCherry at DIV3 and assayed at DIV7–8. Neurons were pretreated with BoNT A or B for 60min followed by treatment with clustered ephrinB2- (+eB2) or control (C) reagents with or without toxins in ACSF for 45–60min. Cell-conditioned ACSF were immunoprecipitated with RFP Trap agarose and immunoblotted for mCherry (top blot, ACSF IP). Cell-conditioned ACSF were probed for beta-actin to show no intracellular protein leaked into the ACSF (Actin, Sup). Cell lysates were probed for mCherry, EphB2 and EphB2 pY662 (as indicated). (I) RNAscope in situ hybridization for Pkdcc (Magenta) in mouse lumbar Dorsal Root Ganglion (DRG) , in Scn10a nociceptors (cyan) and Merged overlay with Nf200 mechanoreceptor cells (blue). Scale bar is 50 μm. (J) Mouse Dorsal Root Ganglion (DRG) have both nociceptor and mechanoreceptor cells marked by Scn10a and Nf200 respectively. (K) Quantification of High Pkdcc expressing neurons (n=8, Nf200 Mean = 23.83, SEM ± 4. 490, Scn10a Mean = 10.95, SEM ± 2.740). (L) RNAscope in situ hybridization for PKDCC (Magenta) in human lumbar DRG, SCN10A (cyan), Lipofuscin (white), DAPI (blue) Scale bar is 50 μm. Merged overlay, scale bar is 50 μm. Inset from overlay showing PKDCC expression in neurons (white arrows) Scale bar is 50 μm. (M) Quantification of PKDCC expressing neurons (n=8, PKDCC Mean = 21. 41, SEM ± 2. 156; SCN10A Mean = 75.98, SEM ± 1.509). (N) Quantified percentage of PKDCC expression in nociceptor and non-nociceptor populations. (n=8, Non-nociceptor Mean = 35.82, SEM ± 2.706; Nociceptor Mean = 16.95, SEM ± 2. 443). (O) A model of the DRG from Pkdcc conditional knockout mice (cKO). Pkdcc-flox mice were crossed to Pirt-Cre line to generate Pkdcc sensory-neuron specific cKO mice (P) RNAscope in situ hybridization for Pkdcc to confirm Pkdcc deletion from sensory neurons in Pkdcc cKO mice. Scale bar is 20 μm (Q) Model of WT and cKO mice (as described above) detailing the experiment to test the effect of Pkdcc deletion in the presynaptic DRG sensory neurons on the EphB2-NMDAR interaction in the dorsal horn (DH) postsynaptic neurons. (R) Immunoblot showing levels of GluN1 co-immunoprecipitated with EphB2 in the DH of cKO mice compared to wildtype littermate controls (WT). A fraction of the same sample was immunoblotted for EphB2 (EphB2, IP). DH lysates were probed as indicated for EphB2 and GluN1.

