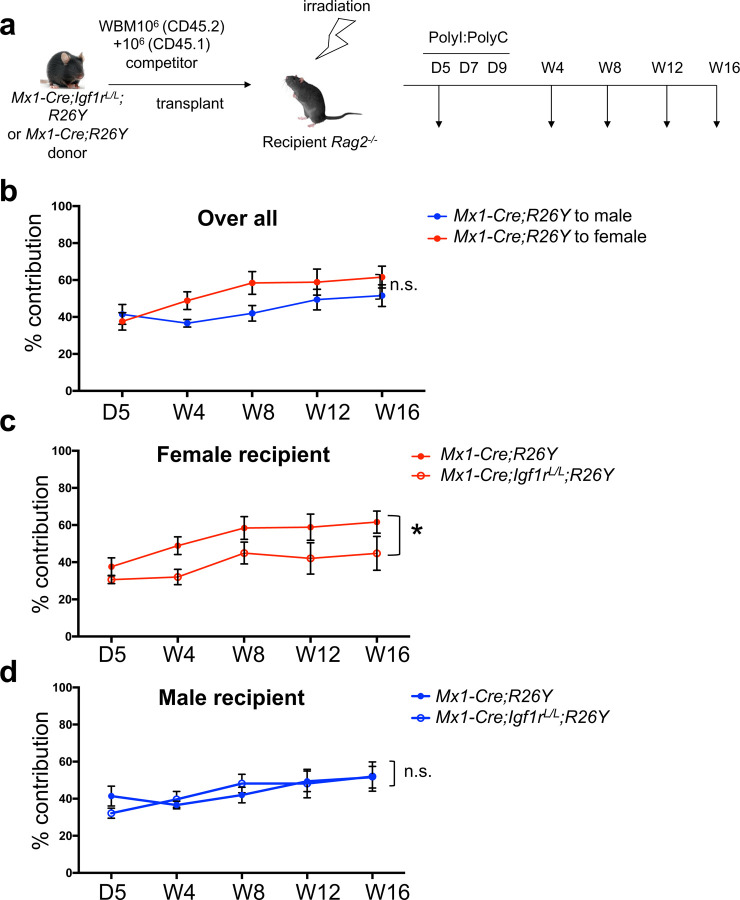
Figure 4. Female microenvironment increases contribution of WT but not Igf1r-null HSCs.
(a) Schematic diagram showing experimental design of the competitive BM transplantation. D: day; W: week. (b) Donor contribution (based on percentage of CD45.2+YFP+ cells) from Mx1-Cre;R26Y (WT) cells in peripheral blood was measured over time in female versus male recipient mice. (c-d) Donor contribution based on percentage of CD45.2+YFP+ cells over time in peripheral blood was measured in both female (c) and male (d) recipient mice. n≥3 for each data point. Data represent mean ± SEM. Pearson’s correlation coefficient analysis was used to calculate the P values for the whole trend. *p<0.05, n.s.=not significant.

