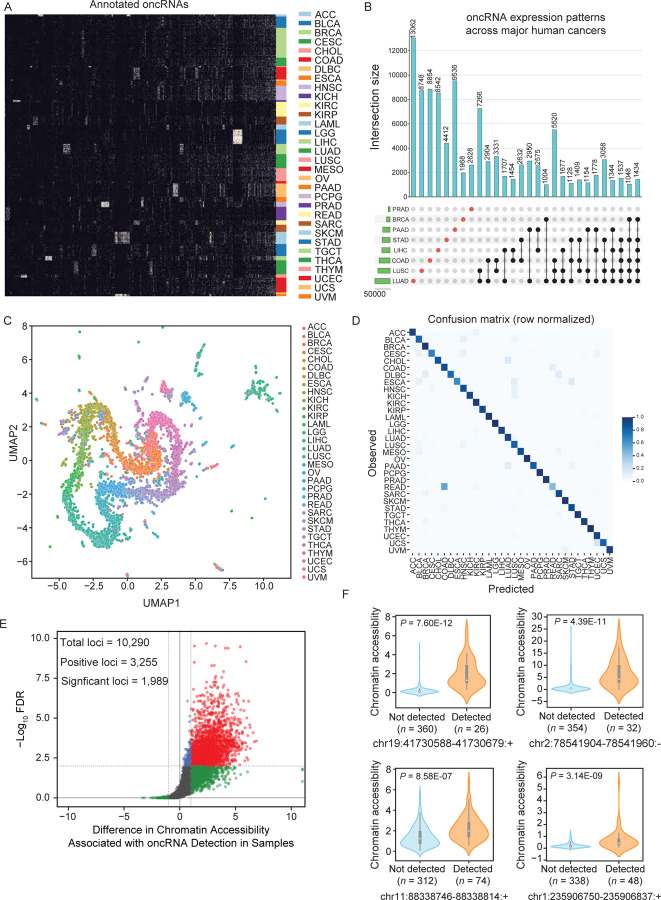
Figure 1. Systematic annotation of oncRNA loci across human cancers using small RNA sequencing data from TCGA and exRNA atlas.
(A) A binary heatmap representing the presence and absence of oncRNA species across human cancers. Here we show a subset of 2,808 of the top significant oncRNAs. The subset was created by selecting 100 of the most significant oncRNAs for each cancer type as determined by the Fisher exact test and collapsing oncRNAs selected multiple times. Each column represents an annotated oncRNA, and each row represents one TCGA sample. Rows were grouped based on their tumor type (TCGA code) and columns were clustered based on their patterns. (B) Number of oncRNAs associated with the major human cancers, namely lung, breast, and gastrointestinal cancers, depicted as an UpSet plot. The vertical blue bars represent the oncRNA counts across one or more cancers with the exact numbers included at the top. (C) A 2D UMAP projection summarizing the oncRNA profiles across TCGA cancer samples. Samples are colored by tumor type. (D) The confusion matrix for tissue-of-origin classification based on oncRNA presence and absence in each sample. The matrix was row-normalized. (E) A volcano plot representing the relationship between chromatin accessibility and oncRNA detection. The x-axis represents, for each oncRNA, the log2 median difference in chromatin accessibility between samples in which the oncRNA was present versus absent. The y-axis shows the significance of the observed differences based on FDR corrected P values calculated using a one-sided Mann-Whitney test. A total of 10,290 oncRNA loci were considered for this analysis based on the coverage of ATAC data. Of these, 3,255 showed a positive association between oncRNA presence and increased chromatin accessibility; of these, 1,989 were also statistically significant at an FDR of 1%. (F) Chromatin accessibility signal of four exemplary oncRNA loci from (E), grouped by the detection of the cognate oncRNA in the small RNA dataset of each sample. Values are shown as violin plots and boxplots. The boxplots show the distribution quartiles, and the whiskers show the quartiles ± IQR (interquartile range). Also reported are the number of samples in which the oncRNAs were detected as well as their associated corrected P values.

