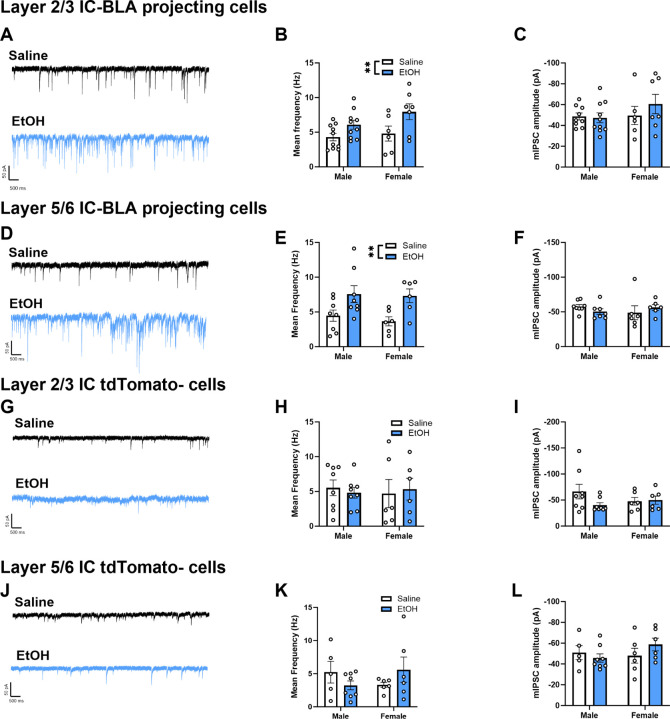
Figure 2. mIPSC frequency, but not amplitude, is higher in cells projecting from the IC to the BLA following ethanol-CTA retrieval.
Representative traces of mIPSCs from layer 2/3 (A) and layer 5/6 (D) IC-BLA projecting neurons 1 hr following saline or ethanol-CTA retrieval. Frequency of mIPSCs was significantly higher in cells from ethanol-conditioned mice compared to saline-conditioned controls, in both layer 2/3 (B) and layer 5/6 (E), whereas amplitude was unaltered (C, F). Representative traces of mIPSCs from the general population (tdTomato-) of IC pyramidal cells in layer 2/3 (G) and layer 5/6 (J) 1 hr following saline or ethanol-CTA retrieval. Both frequency (H,K) and amplitude (I,L) of mIPSCs in tdTomato- cells were unchanged by retrieval of ethanol-CTA compared to saline-conditioned controls, regardless of layer (**p<0.01, main effect of ethanol).

