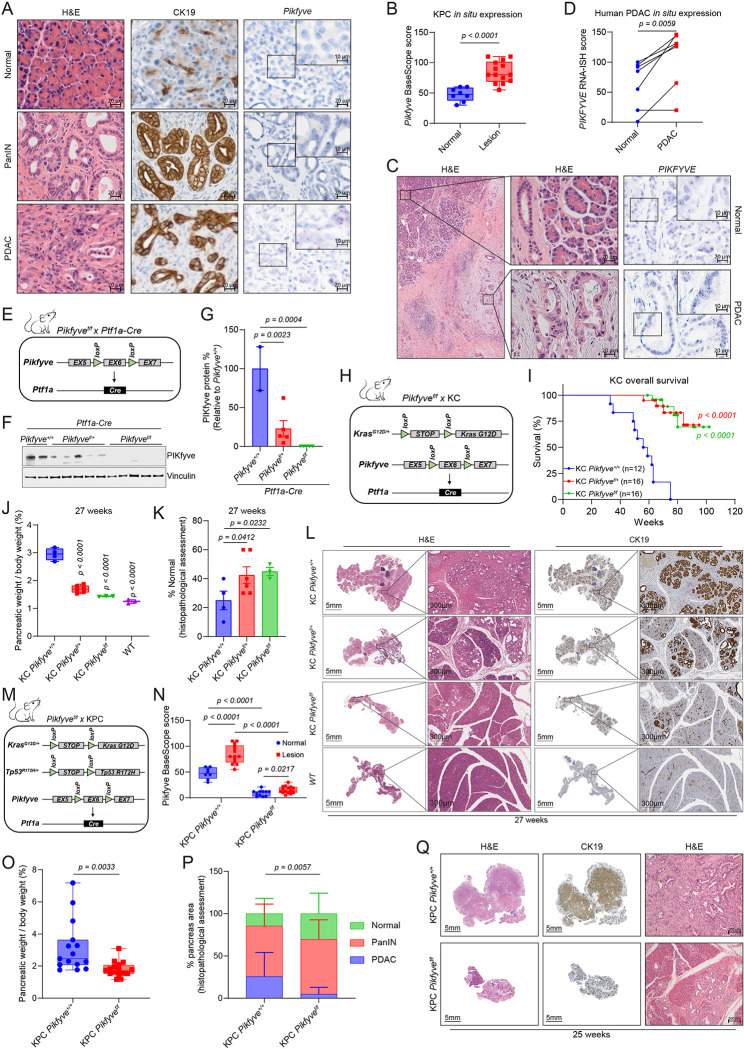
Figure 1: Pikfyve is essential for progression of precursor PanIN lesions to PDAC.
A. Representative images of PanIN or PDAC lesions and normal tissue taken from a KPC murine pancreas, showing H&E, IHC staining for CK19, and BaseScope for Pikfyve. Scalebar = 20μm for low-magnification images and 10μm for high-magnification images.
B. In situ Pikfyve levels in KPC murine pancreas lesion (PanIN or PDAC) vs normal tissue as determined by BaseScope RNA-ISH probes targeting Pikfyve exon 6. (Unpaired two-tailed t-test)
C. Representative image of one human PDAC patient sample, showing H&E (left and middle sections) or PIKFYVE RNA-ISH (right). Scalebars are 200μm (left), 20μm (middle), 20μm (right, low magnification), and 10μm (right, high magnification).
D. In situ PIKFYVE levels in histologically normal or PDAC cells in seven human PDAC patient samples using RNA-ISH (RNAScope). Biospy samples were taken from five independent PDAC patients: two patients donated two samples each from distinct biopsies. Scores were determined as described in methods. (Paired two-tailed t-test)
E. Breeding design for the generation of Pikfyve specific deletion in Ptf1a-Cre mice.
F. Immunoblot analysis of pancreatic tissue from 12-week-old Ptf1a-Cre; Pikfyve+/+, Ptf1a-Cre; Pikfyvef/+, and Ptf1a-Cre ; Pikfyvef/f mice showing changes in PIKfyve protein levels. Vinculin was used as a loading control.
G. Densitometry analyses of immunoblot displayed in Fig. 1F. PIKfyve protein % was calculated by dividing the densitometry values for each PIKfyve band by the average value from the Pikfyve+/+ group. (One-way ANOVA with Dunnett’s)
H. Breeding design for the generation of KC Pikfyve+/+, KC Pikfyvef/+, KC Pikfyvef/f mice.
I. Overall survival of KC Pikfyve+/+, KC Pikfyvef/+, KC Pikfyvef/f mice. Statistics were performed using a Gehan-Breslow-Wilcoxon test.
J. Pancreas tissue weight normalized to total body weight from KC Pikfyve+/+, KC Pikfyvef/+, KC Pikfyvef/f or age-matched wild-type (WT) mice at 27 weeks of age. (One-way ANOVA with Dunnett’s)
K. Percentage of pancreas occupied by normal tissue as determined by histological analyses in KC Pikfyve+/+, KC Pikfyvef/+, KC Pikfyvef/f mice at 27 weeks of age. (One-way ANOVA with Dunnett’s)
L. Representative histological images showing H&E and CK19 staining on pancreatic tissue of KC Pikfyve+/+, KC Pikfyvef/+, KC Pikfyvef/f mice at 27 weeks of age. Scalebar = 5mm for the whole-pancreas images, 300μm for the zoomed-in images.
M. Breeding design for the generation of KPC Pikfyve+/+ and KPC Pikfyvef/f mice.
N. In situ Pikfyve levels in KPC Pikfyve+/+ and KPC Pikfyvef/f murine pancreas lesion vs normal tissue as determined by BaseScope. The KPC Pikfyve+/+ scores used as a reference are the same as those used in Fig. 1B. The two cohorts were stained and analyzed in the same batch. (Multiple unpaired two-tailed t-test)
O. Pancreas tissue weight normalized to total body weight from KPC PIKfyve+/+ or KPC PIKfyvef/f mice at death. (Unpaired two-tailed t-test)
P. Percentage of pancreas occupied by normal, pancreatic intraepithelial neoplasia (PanIN), or PDAC at death. (Two-way ANOVA).
Q. Representative histology showing CK19 IHC and H&E staining of whole pancreatic tissue from KPC PIKfyve+/+ and KPC PIKfyvef/f mice at 25 weeks. Scalebar = 5mm for the whole-pancreas images, 100μm for the high-magnification images.

