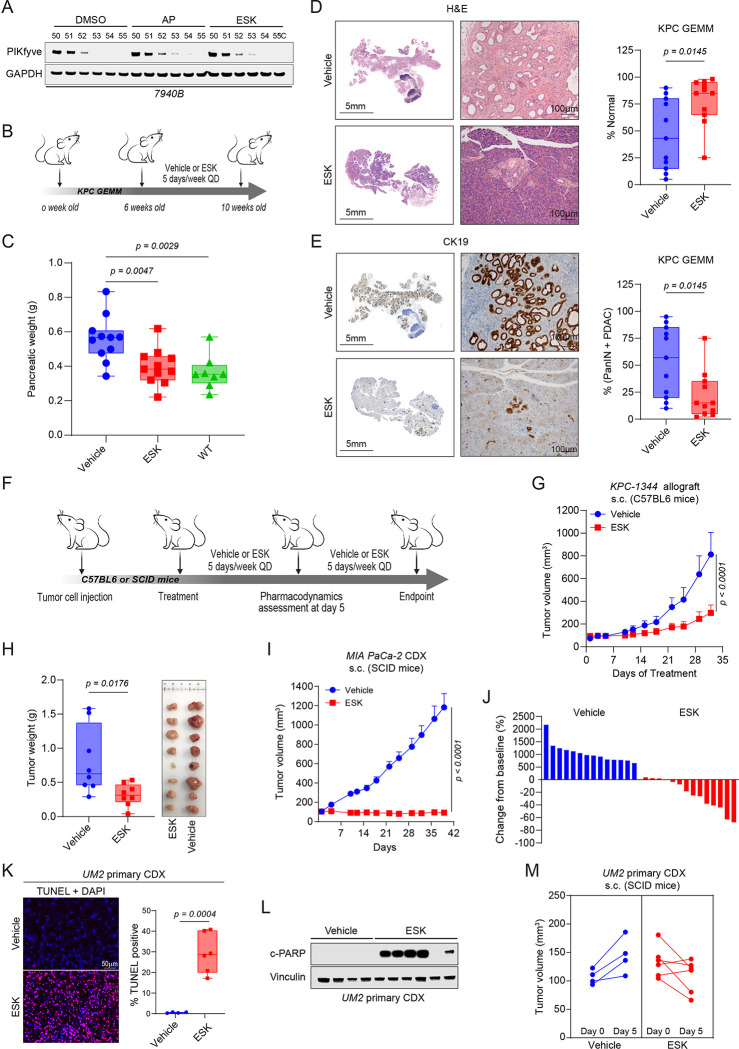
Figure 2: Pharmacological inhibition of PIKfyve blocks pancreatic cancer progression in vivo.
A. Immunoblot analysis demonstrating stabilization of PIKfyve by apilimod (AP, 1000 nM) or ESK981 (ESK,1000 nM) in a cellular thermal shift assay (CETSA) employing the murine KPC cell line 7940B.
B. Schematic of the in vivo study to assess prophylactic efficacy of vehicle or ESK981 (30 mg/kg) on KPC mice.
C. Pancreatic tissue weight in vehicle- or ESK981 (30 mg/kg, QD, PO) -treated KPC mice in comparison with age-matched wild-type (WT) mice (right panel). (One-way ANOVA with Dunnett’s)
D. Representative H&E staining of whole pancreatic tissue from vehicle and ESK981 treated mice (left). Quantification of histologically normal pancreatic tissue in vehicle or ESK981 treated mice (right). (Unpaired two-tailed t-test). GEMM: genetically engineered mouse model. Scalebar = 5mm for the whole-pancreas images, 100μm for the zoomed-in images.
E. Representative CK19 IHC staining of whole pancreatic tissue from vehicle or ESK981 treated mice (left). Quantification of lesions (PanIN or PDAC) in vehicle or ESK981 treated mice (right). (Unpaired two-tailed t-test). Scalebar = 5mm for the whole-pancreas images, 100μm for the zoomed-in images.
F. Schematic of in vivo efficacy studies utilizing cell-derived xenograft (CDX) or allograft models. ESK981 was dosed at 30 mg/kg per day (PO) in all studies.
G. Tumor volumes of subcutaneous allograft model using KPC-derived KPC-1344 cells in response to vehicle or ESK981 in C57BL6 mice. Data plotted are mean tumor volumes + SEM (n=8 for each cohort). (Two-way ANOVA)
H. Tumor weights (left) and images (right) of KPC-1344 model tumors at study endpoint. (Unpaired two-tailed t-test)
I. Tumor volumes of subcutaneous CDX model using MIA PaCa-2 cells in response to vehicle or ESK981 in SCID mice. Data plotted are mean tumor volumes +SEM (n=14 for each cohort) (Two-way ANOVA).
J. Waterfall plot displaying changes in tumor volume comparing endpoint to baseline in response to vehicle or ESK981 treatment.
K. Left panel, representative images (one of three) of TUNEL staining from primary UM-2 CDX tumors after 5 days of treatment of vehicle or ESK981. Right panel, quantification of TUNEL positivity in indicated groups. Data plotted are from independent tumors and each represent the mean of 5 representative images per tumor. (Unpaired two-tailed t-test). Scalebar = 50μm
L. Immunoblot analysis of primary UM2 CDX tumors after 5 days treatment of vehicle or ESK981 showing changes in apoptosis marker cleaved PARP (c-PARP). Vinculin was used as a loading control.
M. Individual tumor volumes of a PDAC primary CDX UM-2 model before and after 5 days treatment of vehicle or ESK981.

