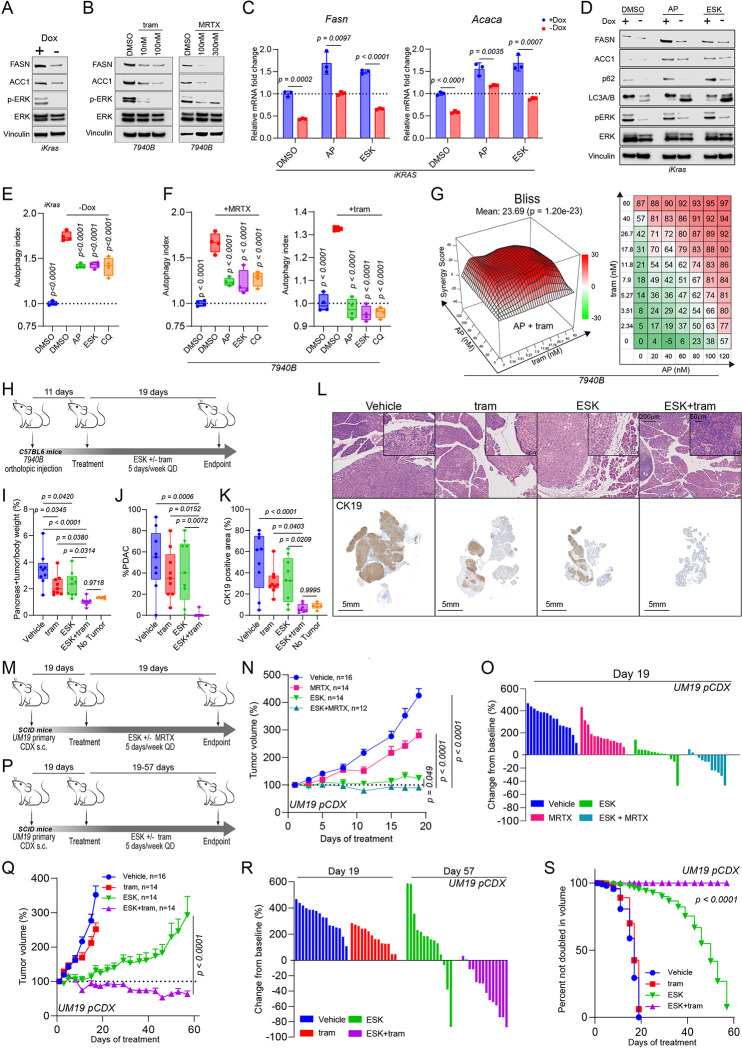
Figure 4: Dual KRAS-MAPK and PIKfyve inhibition results in metabolic crises and synergistic growth suppression in PDAC.
A. Immunoblot analysis of iKRAS 9805 cells showing changes in protein levels of FASN and ACC1 upon presence or absence of doxycycline for 72 hours. Phospho-ERK and ERK were used to validate KRAS-MAPK signal inhibition. Vinculin was used as a loading control. This is representative of two independent experiments.
B. Immunoblot analysis of 7940B cells treated with MEK inhibitor trametinib (tram) or KRASG12D inhibitor MRTX1133 (MRTX) for 48 hours at the indicated concentrations showing changes in protein levels of FASN and ACACA. Phospho-ERK and ERK were used to validate on-target effects on KRAS-MAPK signaling. Vinculin was used as a loading control. MRTX1133 and DMSO were refreshed every 12 hours in experiments involving MRTX1133. These experiments were each performed independently twice with similar results.
C. qPCR of iKRAS 9805 cells showing changes in mRNA levels of Fasn (left) and Acaca (right) upon 48-hour incubation with or without doxycycline (Dox) and subsequent 8-hour treatment with apilimod (50 nM), ESK981 (300 nM), or DMSO. Data shown are technical replicates (multiple unpaired two-tailed t-tests). This experiment was performed independently three times each.
D. Immunoblot analysis of iKRAS 9805 cells showing changes in protein levels of FASN, ACC1, p62, and LC3A/B upon 48-hour incubation with or without doxycycline (Dox) and subsequent 24-hour treatment with apilimod (50 nM), ESK981 (300 nM), or DMSO. p-ERK and ERK were assessed to validate KRAS OFF. Vinculin was used as a loading control. This is representative of two independent experiments.
E. Tandem fluorescent reporter assay on iKRAS 9805 cells showing changed autophagic flux upon doxycycline withdrawal for 24 hours and subsequent treatment with apilimod (100 nM), ESK981 (1000 nM), or chloroquine (10 μM) for 24 hours. (One way ANOVA with Dunnett’s). This data is representative of three independent experiments each.
F. Tandem fluorescent reporter assay on 7940B cells showing changed autophagic flux upon 4-hour pretreatment with apilimod (100 nM), ESK981 (1000 nM), or chloroquine (50 μM) and subsequent treatment with MRTX1133 (300 nM) or trametinib (25 nM) for 24 hours (One-way ANOVA with Dunnett’s). This data is representative of three independent experiments each.
G. 3D synergy and corresponding heatmap plots in 7940B cells treated with apilimod and trametinib. Red peaks in the 3D plots indicate synergism, and the overall average synergy score is listed above. The heatmap plots the decrease in viability in 7940B upon treatment with each single agent or combination across indicated doses of each inhibitor. This experiment was performed three independent times with similar results.
H. Schematic outlining syngeneic orthotopic model of 7940B for C57BL/6 mice assessing in vivo efficacy of ESK981 (ESK, 30 mg/kg, QD, PO), trametinib (tram, 1 mg/kg QD, PO), or ESK981 and trametinib (ESK + tram).
I. Endpoint pancreas + tumor weight normalized to total body weight. Pancreata of 6 age-matched non-tumor bearing C57BL/6 mice were used as references. (One-way ANOVA with Tukey’s)
J. Quantification of proportion of PDAC in H&E section from each tumor of the 7940B syngeneic orthotopic model. (One-way ANOVA with Tukey’s)
K. Quantification of CK19 positive area compared to hematoxylin counterstain on a section from each tumor of the 7940B syngeneic orthotopic model. (One-way ANOVA with Tukey’s)
L. Representative images of H&E and CK19 IHC staining of one tumor from each treatment arm from 7940B syngeneic orthotopic model. Scalebar = 200μm for the zoomed-out H&E images; 50μm for the zoomed-in H&E images; and 5mm for the whole-pancreas CK19 IHC images.
M. Schematic outlining efficacy study using subcutaneous model of UM-19 primary cell-derived xenograft (CDX) treated with vehicle, MRTX1133 (MRTX, 30 mg/kg, QD, IP), ESK981 (ESK 30 mg/kg, QD, PO), or ESK981 + MRTX1133 (ESK + MRTX).
N. Tumor volumes as a percentage (+SEM) of the initial volume measured by calipers over treatment course of the UM19 primary CDX (pCDX) model treated with MRTX1133 +/− ESK981. Statistics were performed using a two-way ANOVA with Dunnett’s, with the combination group used as the reference.
O. Waterfall plot displaying change in tumor volume at treatment end point (day 19) compared to baseline of the UM19 pCDX model treated with MRTX1133 +/− ESK981.
P. Schematic outlining efficacy study using subcutaneous model of UM19 pCDX treated with vehicle, trametinib (tram, 1 mg/kg, QD, PO), trametinib (tram 1 mg/kg QD, PO), ESK981 (ESK 30 mg/kg, QD, PO), or ESK981 + trametinib (ESK + tram).
Q. Tumor volumes as a percentage (+SEM) of the initial volume measured by calipers over treatment course of the UM19 pCDX model treated with trametinib +/− ESK981. Statistics were performed using a two-way ANOVA with Dunnett’s, with the combination group used as the reference. The tumors in the vehicle- and ESK981-treated groups were the same tumors shown in Fig. 4O.
R. Waterfall plot displaying change in tumor volume at treatment end point compared to baseline of the UM19 CDX model treated with trametinib +/− ESK981. The endpoint displayed of the vehicle and trametinib arms are day 19. The endpoint displayed of the ESK981 and ESK981 +/− trametinib group are day 57. The tumors in the vehicle- and ESK981- treated groups were the same tumors shown in Fig. 4O.
S. Kaplan–Meier estimates of time to tumor doubling (Gehan-Breslow-Wilcoxon test).

