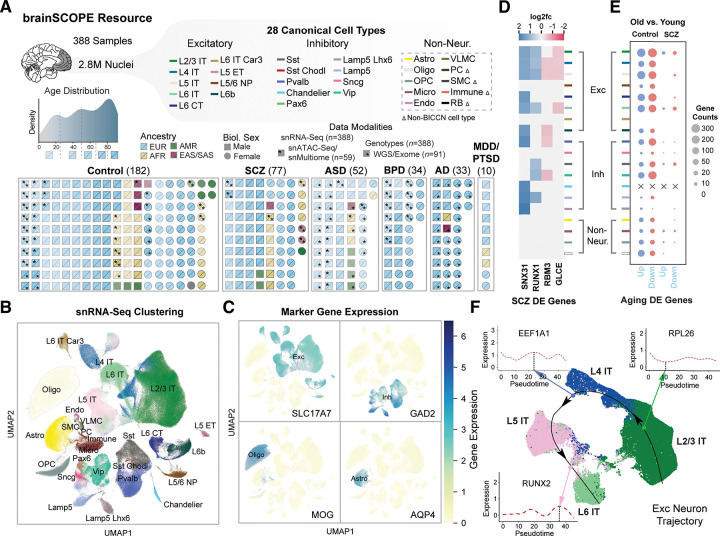
Figure 1. Constructing a single-cell genomic resource for 388 individuals.
(A) Overview of the integrative single-cell analysis performed on 388 adult prefrontal cortex samples. (Top) Schematic for 28 cell types grouped by excitatory (Exc), inhibitory (Inh), and non-neuronal cell types (table S3); color labels for each subclass are used consistently throughout all figures (table S4). Dashed box indicates cell types defined with Ma-Sestan marker genes (19), with Δ indicating cell types unique to Ma-Sestan (Bottom) Schematic showing all samples labeled by disease, biological sex, ancestry, age, and available data modalities, including a distribution plot for sample ages (gray indicates pediatric samples excluded from most analyses). (B) UMAP plot for clustering of 28 harmonized cell types from snRNA-seq data derived from 72 samples in the SZBDMulti-seq cohort (using this study as an example of pan-cohort cell typing; see fig. S10 for UMAPs of other studies). (C) UMAP plots highlighting expression of key marker genes in four broad cell types (excitatory: SLC17A7; inhibitory: GAD2; oligodendrocytes: MOG; and astrocytes: AQP4). (D) Differential expression (log2-fold change) of four schizophrenia-related genes across cell types in samples from individuals with schizophrenia (blue for upregulation, red for downregulation). (E) Numbers of DE genes upregulated (blue) and downregulated (red) in older (>70 years) control (left) and schizophrenia (right) individuals per cell type when compared with younger individuals in each group (<70 years). “X” indicates no DE genes were observed for a particular cell type. (F) UMAP plot showing predicted trajectory for excitatory IT neurons in adult control samples from the SZBDMulti-seq cohort. The predicted trajectory proceeds along the cortical layer dimension from L2/3 to L6 in the prefrontal cortex. Inset highlights log-normalized gene expression in cells along the pseudotime axis for three genes.

