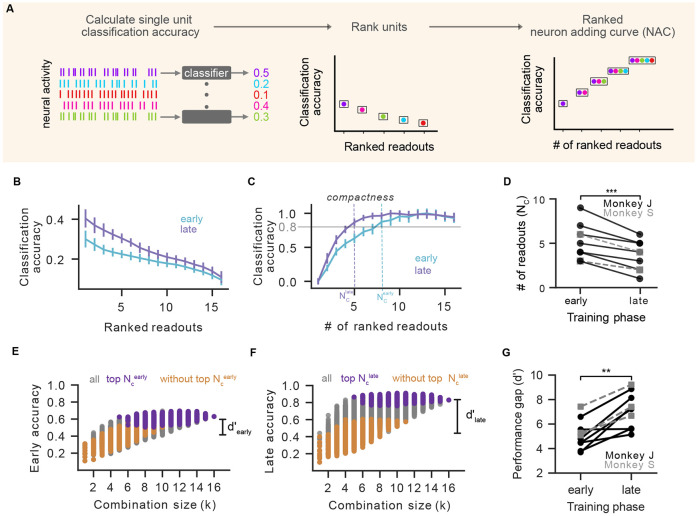
Figure 4. Learning leads to compaction of neural representations:
(A) Schematic of the ranked Neuron Adding Curve (NAC) analysis. We first estimated classification accuracies of individual units (left), ranked units based on their classification power (middle) and then constructed a neuron adding curve by starting with the best unit, adding the second best unit and so on (right) (see Methods). (B) Ranked classification accuracy of individual units on early (cyan) and late (purple) day for the selected series. (C) Ranked NAC on early (cyan) vs late (purple) day for the selected series. Each day’s classification accuracy was normalized to the day’s peak performance. Vertical dashed lines indicate number of units required to reach 80% of peak accuracy (). (D) Comparison of and across series (, p = 9.8 × 10⁻⁴(* * *), N = 10, one sided Wilcoxon signed-rank test). Monkey J data shown in black circles; monkey S shown in grey squares. (E) Classification accuracy as a function of readout population size (combinatorial NAC) for early day. Combinations with top units (deep purple) and without top units (orange). Distance between distributions defined as the discriminability index . (F) Same as (E) for late day. (G) Comparison of distance between distributions between early and late learning ( vs ) across series (, p = 1.9 × 10⁻³(**), N = 10, one sided Wilcoxon signed-rank test). Formatting as in panel D.

