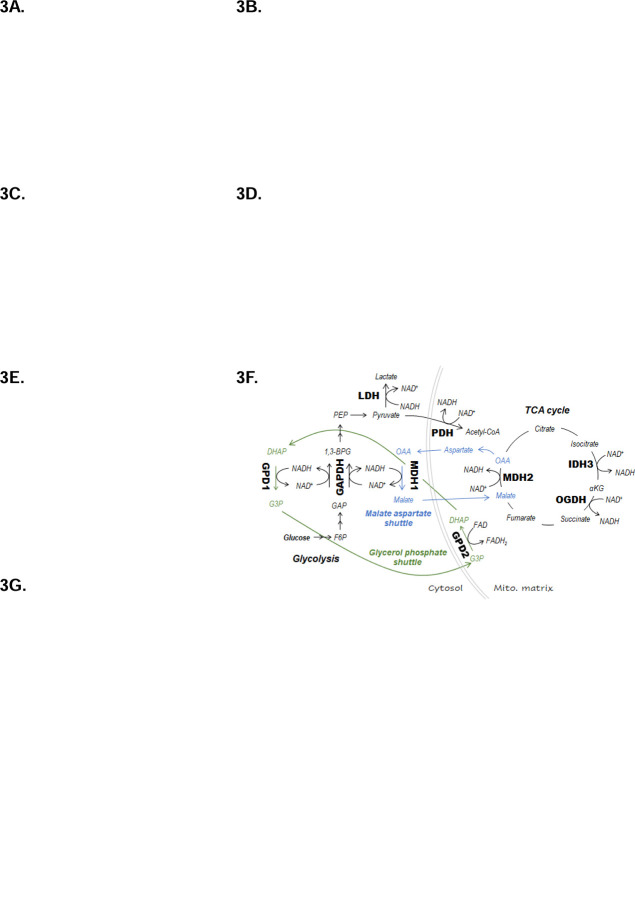
Figure 3: Perturbation of oxidative metabolism and redox homeostasis in stimulated CD28iKO hBCMAmBBmζ CAR T cells.
(A) Representative Seahorse Glycolysis Stress Test performed 24 hr. after stimulation of CD28fl/fl or CD28iKO hBCMAmBBmζ CAR T cells with 5TGM1hBCMA myeloma cells. Connected data points represent mean extracellular acidification rate (ECAR) ± SD of four technical replicates at indicated time points during a representative experiment that was repeated at least 3 times. Dashes indicate the timing of glucose, oligomycin (Oligo) and 2-deoxyglucose (2-DG) injection.
(B) Quantified rates of glycolysis (left), glycolytic capacity (middle), and glycolytic reserve (left) in CD28fl/fl or CD28iKO hBCMAmBBmζ CAR T cells ± 24-hr. stimulation with 5TGM1hBCMA myeloma cells. Bars represent mean ± SD, dots represent independent experiments. ns = not significant by one-way ANOVA.
(C) Representative Seahorse Mito Stress Test performed 24 hr. after stimulation of CD28fl/fl or CD28iKO hBCMAmBBmζ CAR T cells with 5TGM1hBCMA myeloma cells. Connected data points represent mean oxygen consumption rate (OCR) ± SD of four technical replicates at indicated time points during a representative experiment that was repeated at least 3 times. Dashes indicate the timing of oligomycin (Oligo), FCCP, and rotenone (Rot) + antimycin A (Ant. A) injection.
(D) Quantified basal OCR (right), uncoupled maximal respiration (middle), and spare respiratory capacity (SRC) expressed as percent of basal OCR (left) in CD28fl/fl or CD28iKO hBCMAmBBmζ CAR T cells ± 24 hr. stimulation with 5TGM1hBCMA myeloma cells. Bars represent mean ± SD, dots represent independent experiments. *p<0.05, **p<0.01 by one-way ANOVA.
(E) Ratio of NADH to NAD+ ratios in CD28fl/fl or CD28iKO hBCMAmBBmζ CAR T cells prior to 4-OHT mediated CD28 deletion or ± 24 hr. stimulation with 5TGM1hBCMA myeloma cells. Bars represent mean ± SD from 3 independent experiments. *p<0.05 by paired Student’s t test.
(F) Diagrams depicting enzymes of central carbon metabolism that interconvert NADH and NAD+.
(G) Relative expression of mRNAs coding enzymes depicted in (F) in CD28iKO versus CD28fl/fl hBCMAmBBmζ CAR T cells following 24 hr. stimulation with 5TGM1hBCMA myeloma cells. Bars represent mean log2 transformed ΔΔCt values ± SD, dots technical replicates pooled from 3 independent experiments. Tbp and Actb were used as endogenous controls. ****p<0.0001 by two-way ANOVA.

