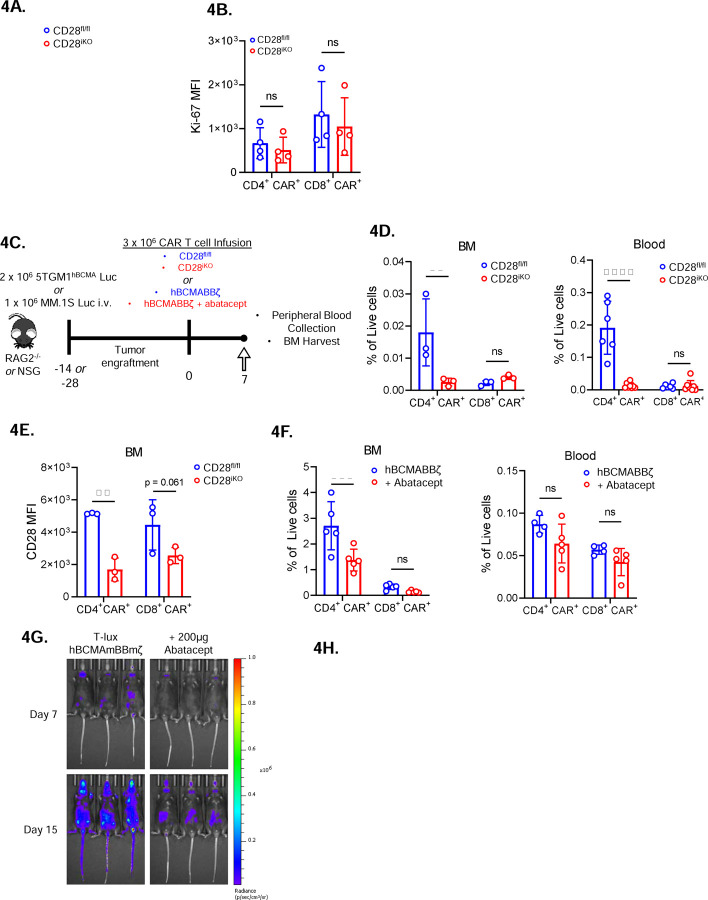
Figure 4: Diminished in vivo expansion of 4-BB co-stimulated CD28iKO CAR T cells.
(A) Expansion of CD28fl/fl versus CD28iKO hBMCAmBBmζ CAR T cells over the course of manufacturing. ns = not significant by two-way ANOVA.
(B) Expression of the proliferation marker Ki-67 in CD28fl/fl versus CD28iKO hBCMAmBBmζ CAR T cells following 24 hr. stimulation with 5TGM1 target cells as assessed by flow cytometric analysis. ns = not significant by one-way ANOVA.
(C) Diagram of experimental setup. 5TGM1hBCMA bearing RAG2−/− mice were treated with CD28fl/fl or CD28iKO hBCMAmBBmζ CAR T cells (4D and 4E) or MM.1S bearing NSG mice were treated with hBCMABBζ CAR T cells ± 200μg abatacept on days −1, 1, 3, 5, 7 (4F) and euthanized 7 days post adoptive transfer for blood collection and hind limb BM harvest.
(D) CAR T cell frequency assessed by flow cytometry in bone marrow (BM, left) and peripheral blood (right) one week after adoptive transfer of CD28fl/fl or CD28iKO hBCMAmBBmζ CAR T cells into 5TGM1hBCMA myeloma bearing mice. Bars represent mean ± SD, dots indicate individual mice (n = 3–6 mice per group). **p<0.01, ****p<0.0001 by two-way ANOVA with Tukey’s multiple comparison test.
(E) CD28 surface protein expression on BM-infiltrating CD28fl/fl or CD28iKO hBCMAmBBmζ CAR T cells one week after adoptive transfer into 5TGM1hBCMA myeloma bearing mice.
(F) CAR T cell frequency assessed by flow cytometry in bone marrow (BM, left) and peripheral blood (right) one week after adoptive transfer of hBCMABBζ CAR T cells into MM.1S myeloma bearing mice ± abatacept. CAR T population identified by surface staining and analyzed by flow cytometry. Bars represent mean ± SD, dots indicate individual mice (n = 4–5 mice per group). ***p<0.001 by two-way ANOVA with Tukey’s multiple comparison test.
(G) Representative IVIS bioluminescence images of T-lux luciferase expressing hBCMAmBBmζ CAR T cells ± abatacept (200μg, 3x/week) on day 7 or day 15 after infusion.
(H) Quantification of photon flux by IVIS imaging within the hind limb region of interest (ROI) over a four-week period following T-lux hBCMAmBBmζ CAR T cell infusion ± abatacept (200μg, 3x/week) into 5TGM1hBCMA myeloma bearing mice. Dots represent individual mice (n = 3 mice per group), lines are best-fit sigmoidal curves, and significance was determined by mixed effects modeling.

