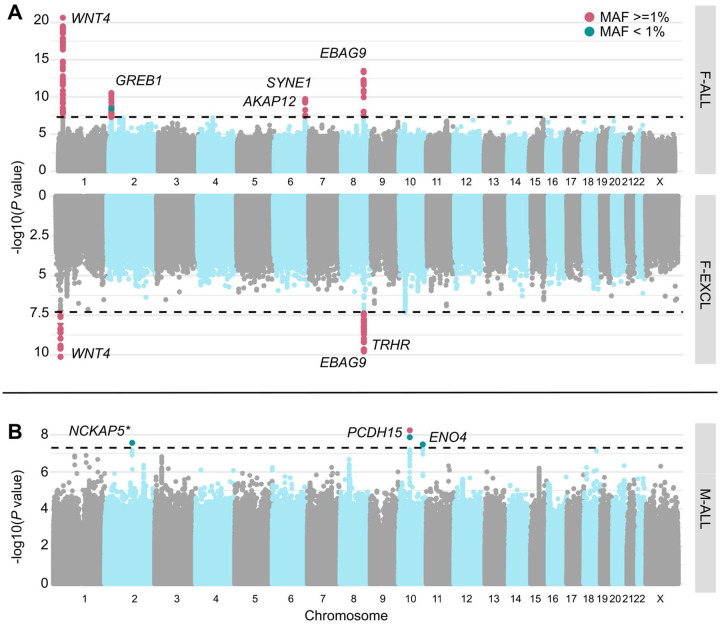
Figure 2. Miami and Manhattan plots for selected infertility meta-analyses.
(A) Genetic variants associated with female infertility of all causes (F-ALL) (top) and idiopathic infertility (unknown causes) defined by exclusion of known causes such as anatomical or anovulatory causes, PCOS, endometriosis, or uterine leiomyomas (bottom). (B) Genetic variants associated with male infertility of all causes (M-ALL). Each point depicts a single SNP, with genome-wide significant (GWS) SNPs (P<5E-08, dashed line) coloured in pink for common variants with minor allele frequency (MAF)>=1% and green for those with MAF<1%. SNPs are annotated with the mapped gene. * indicates that lead variant is reported in only one cohort.

