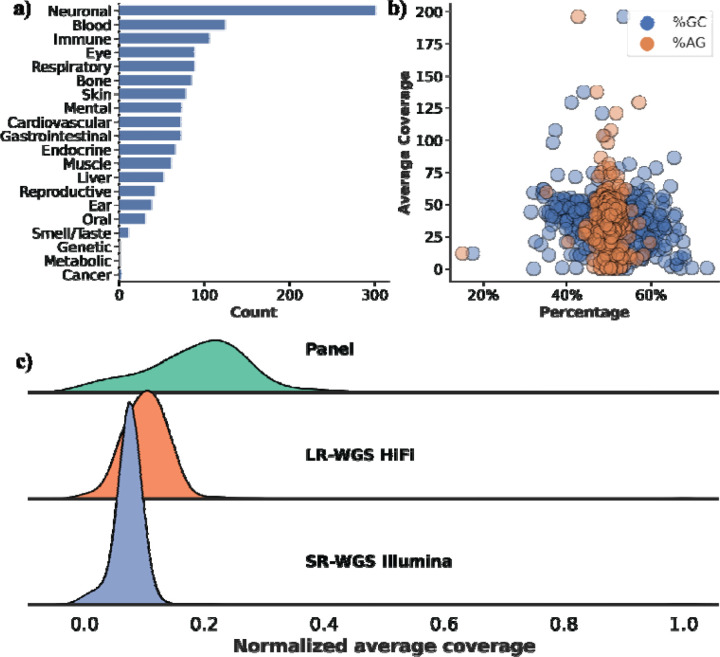
Figure 1. Characteristics of the 389 TADGP genes and their linked diseases.
a) Gene count per disease, the X-axis is the count of genes associated with each disease, and the Y-axis is the disease category. b) GC% (in blue) and AG% (in orange) per gene vs. average gene coverage for sample HG002. The GC% affecting HiFi coverage is minimal, while AG% has no impact. c) Normalized average gene coverage between the panel (green), LR-WGS HiFi (orange), and SR-WGS Illumina (blue). TADGP has the highest normalized average coverage.

