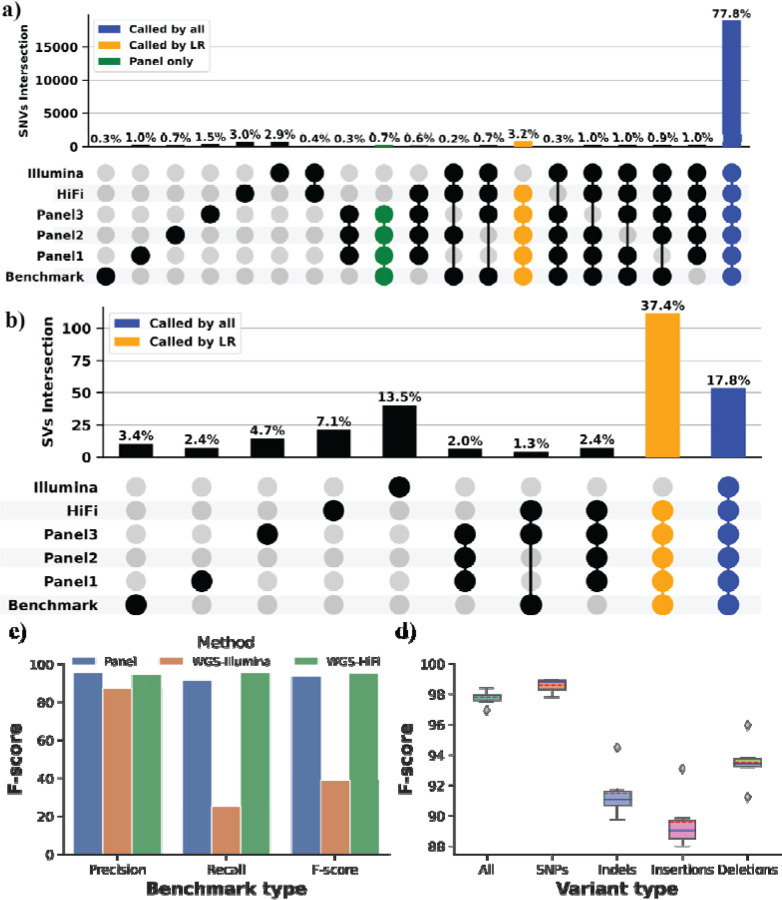
Figure 3. Performance assessment across samples HG001 to HG007.
a) Comparison of unique and shared variants (SNVs/Indels) represented by Upset: TADGP (three replicate), HiFi LR-WGS, and Illumina SR-WGS for sample HG002. The blue column signifies the concordance observed among all datasets, the yellow column represents variants that were not called using Illumina dataset, and the green column highlights variants exclusive to the panel that are not present in either HiFi LR-WGS and Illumina SR-WGS. b) Comparison of unique and shared SVs represented by Upset. In the plot, the blue color represents SVs that are shared across all datasets, while the yellow color represents SVs that are absent when using the SR-WGS Illumina dataset. c) Comparison of SVs across the panel (Blue), WGS-illumina (Orange), and WGS-HiFi (Green), on the X-axis is the Precision, Recall, and F-score and the percentage on the Y-axis. d) A boxplot displays the F-score for SNVs and indels, for samples HG001, 3, 4, 5, 6 and 7 with the data split into five categories: All (SNPs and Indels), SNPs (substitutions only), Indels (insertions and deletions), insertions only, and deletions only. The Y-axis represents the F-score percentage, while the boxplot depicts the median with a solid blue line and the mean with a dashed red line.

