
Figure 3.
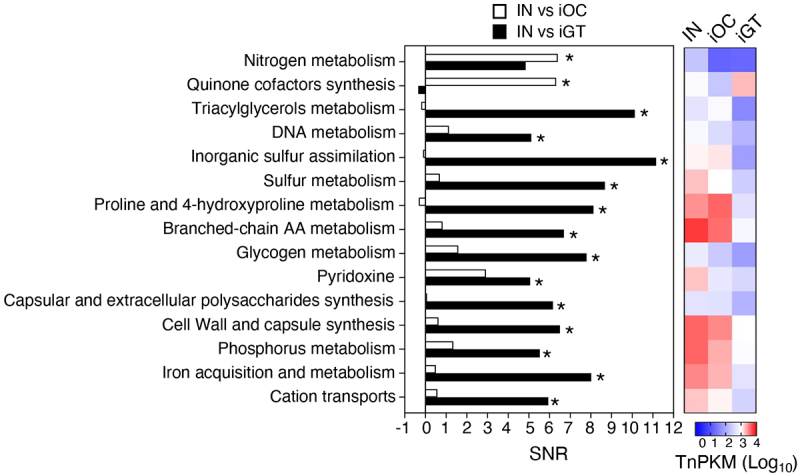
Functional pathways required for the colonization in the oral and gut mucosae. The genes were grouped in functional categories and an SNR analysis was performed using input/output ratios of TnPKM sums (left). The heatmap (right) shows the transposon mutant gene abundance (log10 averaged TnPKM, n = 4 to 6 mice) in the input (IN), the inflamed oral cavity (iOC), and the inflamed gut (iGT). The positive values of SNR indicate more in input. *, statistically significant TnPKM ratio (fold differences > 10, absolute SNR (|SNR|) > 5, p < 0.05, FDR < 0.05). AA, amino acid; TnPKM, transposon (tn) densities per kilobase per million mapped reads; SNR, signal-to-noise ratio; FDR, false discovery rate.