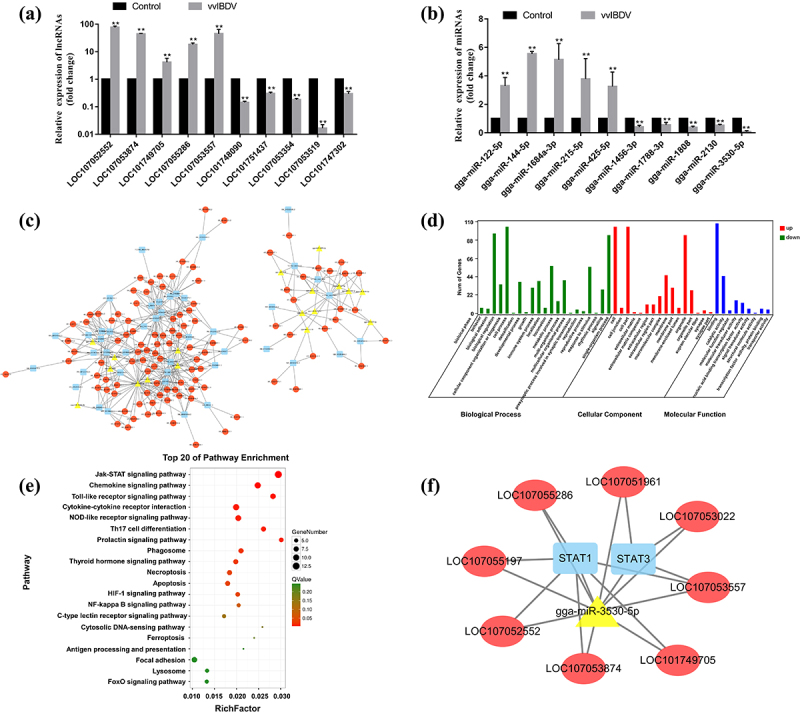
Figure 1.

Effects of vvIBDV infection on differentially expressed lncRnas and miRnas, and the construction of ceRNA regulatory networks. (a and b) validation of the differentially expressed lncRnas and miRnas using RT-qPCR. (c) The lncRNA-miRNA-mRNA regulatory network was constructed and generated by cystoscope software. The red ellipses, yellow triangles, and blue rectangles represent lncRnas, miRnas, and mRnas, respectively. (d) Significantly enriched GO pathways with p values of < 0.05. (e) Significantly enriched KEGG pathways with p values of < 0.05. (f) The lncRNA-miRNA-mRNA (JAK-STAT signalling pathway) regulatory network.
