FIGURE 1.

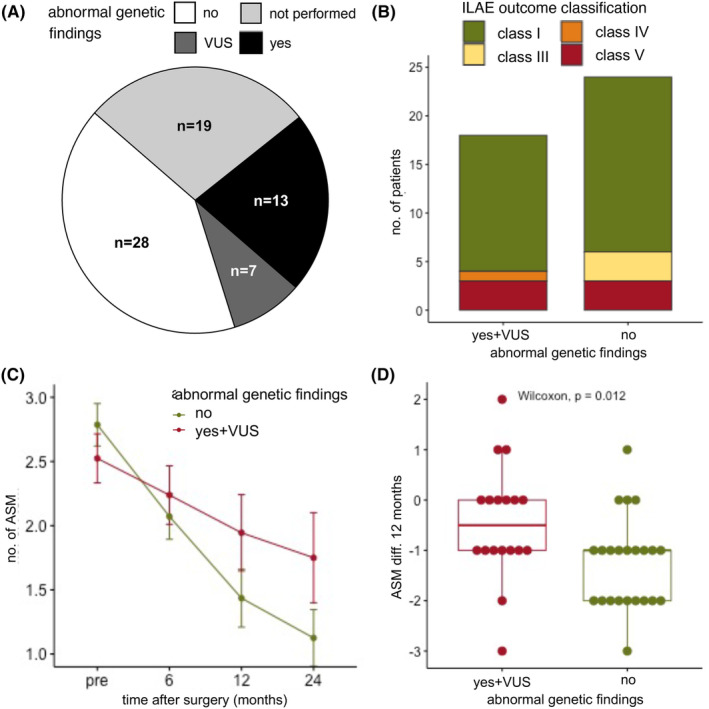
Seizure outcome and reduction of antiseizure medication (ASM) based on genetic findings. (A) In our cohort, a total of 49 patients had genetic testing, of these, 28 patients (57%) had no abnormal genetic finding, 7 patients (12%) had a variant of unknown significance (VUS), and 14 patients (31%) had a pathological genetic finding. Two patients an ACMG classification of IV (likely pathogenic) and 12 patients of V (pathogenic). (B) There was no statistical difference between the ILAE outcome classes after 12 months between patients with a normal (total = 24, ILAE class I: n = 18 (75%), class III: n = 3 (12.5%), class V: n = 3 (12.5%)) and abnormal genetic testing (incl. VUS, total = 18, ILAE class I: n = 14 (77.8%), class IV: n = 1 (5.6%), class V: n = 3 (16.7%) chi‐square test, p = 0.31)). (C) The number of ASM could be significantly reduced when comparing presurgery (n = 49, mean ± SD: 2.67 ± 0.88 ASM, range 1–4 ASM), 6 months after surgery (n = 49, mean ± SD: 2.14 ± 0.98 ASM, range 0–4), 12 months after surgery (n = 41, mean ± SD: 1.66 ± 1.17 ASM, range 0–5 ASM), and 24 months after surgery (n = 28, mean ± SD: 1.39 ± 1.07 ASM, range 0–5 ASM, Kruskal–Wallis test, p < 0.0001). (D) The absolute reduction of ASM (ASM diff.) between presurgery and after 12 months was significantly higher in patients with abnormal genetic testing (n = 41, Wilcoxon test, p = 0.012, normal genetic testing, n = 23: mean ± SD: −1.26 ± 0.92 ASM, range −3 to 1 ASM, abnormal genetic testing incl. VUS, n = 18: mean ± SD: −0.44 ± 1.15 ASM, range −3 to 2 ASM).
