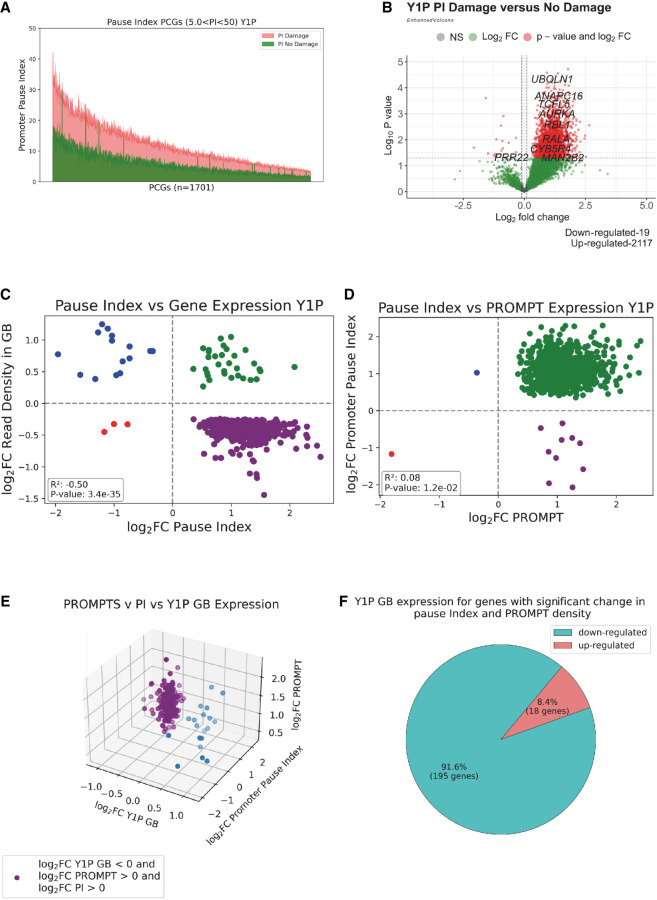
Figure 3.
Y1P RNA Pol II–transcribed PROMPTs are associated with an increased promoter pausing index upon IR. (A) Line plot showing change in the pause index (PI) of PCGs from Y1P samples upon IR. Genes with a moderate PI (5 < PI < 50) are sorted based on the PI, and each point on the x-axis represents a gene; green lines show its PI in a no-damage condition, and orange lines show its PI in a damage condition. (B) Volcano plots showing differential PI of PCGs from Y1P samples upon IR. (C) Scatter plot showing the log2FC in GB expression with the associated log2FC in PI of PCGs from Y1P samples on radiation treatment. Only PCGs that show a significant P-value (P < 0.05) change in the PI and GB from Y1P upon IR were included in the analysis. (D) Scatter plot showing the log2FC in PROMPT expression with the associated log2FC in the PI of PCGs from the Y1P sample on radiation treatment. Pearson correlation coefficient and P-value show correlation between PROMPT expression and the PI change of PCGs from Y1P sample on radiation treatment. Only PCGs that show a significant P-value (P < 0.05) change in the PROMPT expression and PI from Y1P samples upon IR were included in the analysis. (E) Three-dimensional scatter plot comparing the log2FC in GB expression with the log2FC in PI and log2FC in the PROMPT of PCGs from Y1P samples on radiation treatment. Only PCGs that show a significant (P < 0.05) change in PROMPT expression, PI, and GB from Y1P samples upon IR were included in the analysis. (F) Pie chart showing the percentage of down-regulated and up-regulated genes among the PCGs that show a significant (P < 0.05) change in PROMPT expression, PI, and GB from Y1P samples upon IR.

