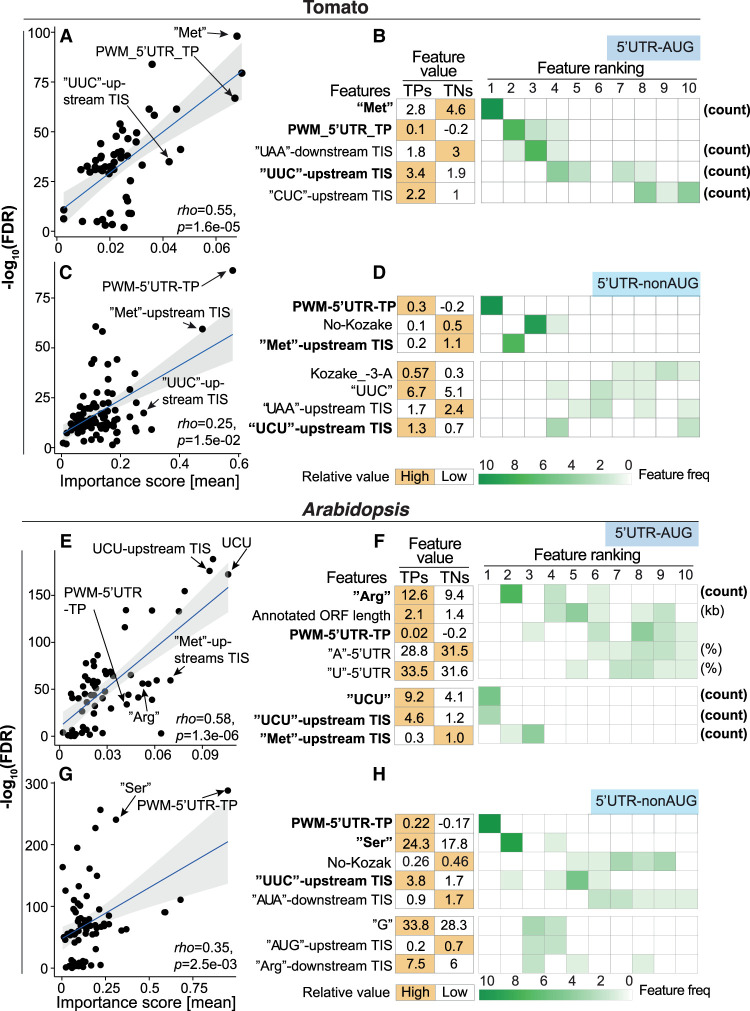
Figure 2.
The features that are most informative for predicting plant 5′ UTR TISs. (A) Comparison of the importance scores derived from the model and the statistical significance of differences (−log10(FDR), determined by a Wilcoxon signed-rank test with Bonferroni correction) between tomato 5′ UTR–AUG TPs and TNs for the features used in the best model. Rho indicates Spearman's rank correlation coefficient. The black line indicates the fitted linear regression line, and the gray area indicates the 95% confidence level interval. (B) The means of the feature values in the tomato 5′ UTR–AUG TP and TN data sets (right) and the frequency of features identified in 10 randomly balanced data sets (left) for the feature elimination–determined top 10 features (ranked using their importance) (see Supplemental Fig. S3A). The rank and frequency indicate the importance of a given feature in the prediction model and their robustness using 10 randomly balanced data sets. The features with a frequency greater than seven within the top 10 are shown. Orange indicates the TIS group with the higher feature value. (C–H) As described in A,B, but for the tomato 5′ UTR–nonAUG TIS group (C,D), the Arabidopsis 5′ UTR–AUG TIS group (E,F), and Arabidopsis 5′ UTR–nonAUG TIS group (G,H). To exclude the possibility of bias arising from random down-sampling, the correlation between two different strategies of random sampling is shown in Supplemental Figure S15.

