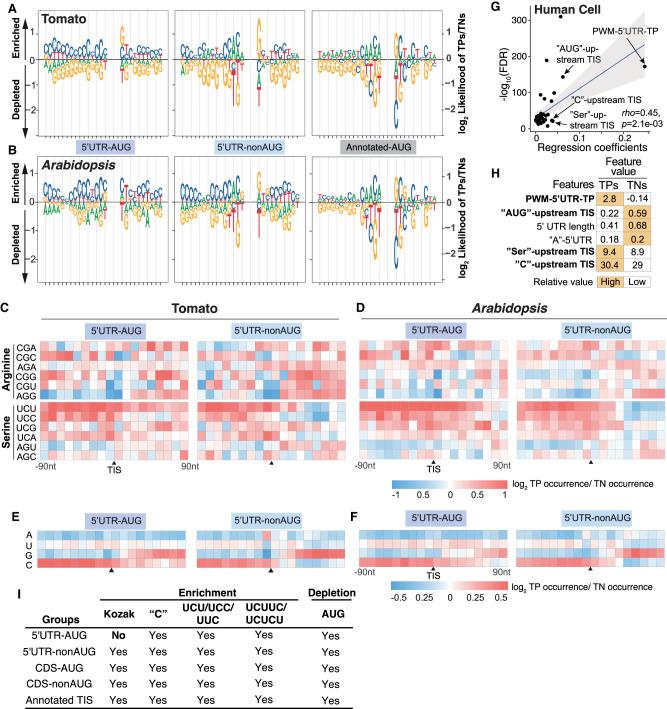
Figure 3.
The C/U nucleotide compositions and the flanking sequences of 5′ UTR TISs. (A,B) Sequence logo plots showing the differential enrichment of A/U/C/G nucleotides between TPs and TNs in the regions 15-bp upstream of and 13-bp downstream from the TISs, represented as the log2 ratio of the site frequencies between TPs and TNs, for the 5′ UTR TISs and annotated AUG sites in tomato (A) and Arabidopsis (B). (C,D) Enrichment of sites with the indicated 3-mer sequences in the tomato (C) and Arabidopsis (D) TIS groups, represented as the log2 ratio of the site frequencies between TPs and TNs in the 180-bp region centered on tomato TISs with a 10-bp window. (E,F) As described in C,D, but for the A, U, C, and G mononucleotides. (G) As described in Figure 2A, but shown for the regression coefficients (x-axis) for the features used in the best linear regression model of predicting human TISs. (H) As described in Figure 2B, but for the top six features with highest regression coefficients in human TIS prediction model. (I) Summary of the ML-revealed features of the Kozak motif (Kozak), the mononucleotide C content (“C”), and CU-rich tracts for their importance across different TIS groups.

